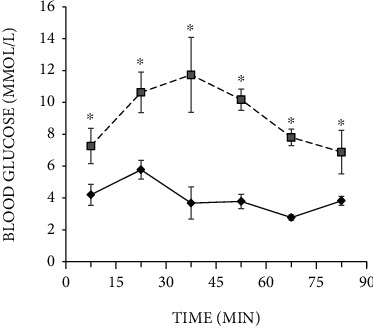
Figure 3.

Intraperitoneal insulin tolerance test on control rats (n = 12, solid line) and rats with T2DM (n = 12, dashed line) before administration of substances. Blood samples were collected from the tail at the indicated time points and analyzed for glucose concentration (mmol/l). Values are means ± SEM. ∗p < 0.05 compared with control.
