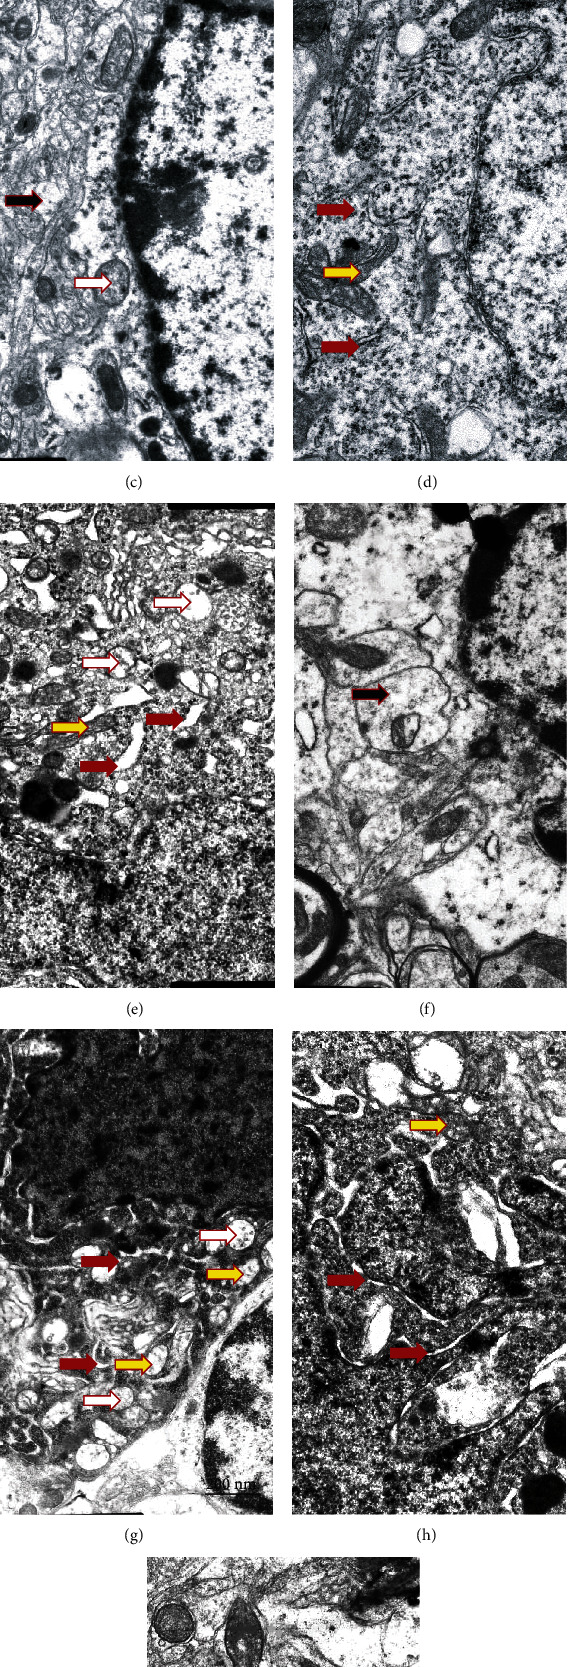
Figure 5.

Ultrastructural changes of VMH neurons and glial cells were assessed by electron microscopy observations. Gallery of micrographs obtained by SEM (n = 12 neurons for each group): (a–c) metformin group; (d–f) PA group; (g–i) metformin and PA group. Representative images of neurons are shown on (a, b, d, e, h, g) and glial cells on (c, f, i). The red arrows indicate the rough endoplasmic reticulum, yellow arrows—mitochondria, white arrows—autophagosomes, and black arrows—neuropil swelling. Scale bar: 200 nm.
