
Figure 7.
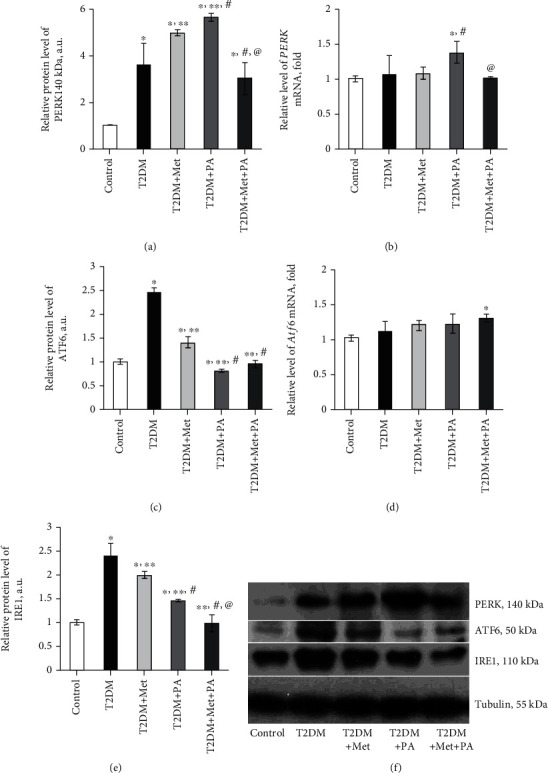
Effects of administration of metformin and PA on the major components of unfolded protein response system—PERK, ATF6, and IRE1. Immunoblotting analysis of PERK, ATF6, and IRE1 in rat VMH: the bar graphs of (a) PERK, (c) ATF6, and (e) IRE1 protein content are presented; (f) representative immunoblots are shown, and data are quantified using tubulin as a loading control for hypothalamus lysates. Quantitative RT-PCR of (b) Perk and (d) Atf6 in rat VMH: data were normalized to β-actin and pooled from three independent experiments (n = 6 rats/group). All data are shown as means ± SEM; ∗p < 0.05 vs. control, ∗∗p < 0.05 vs. T2DM, #p < 0.05 vs. metformin administration, and @p < 0.05 vs. PA administration.