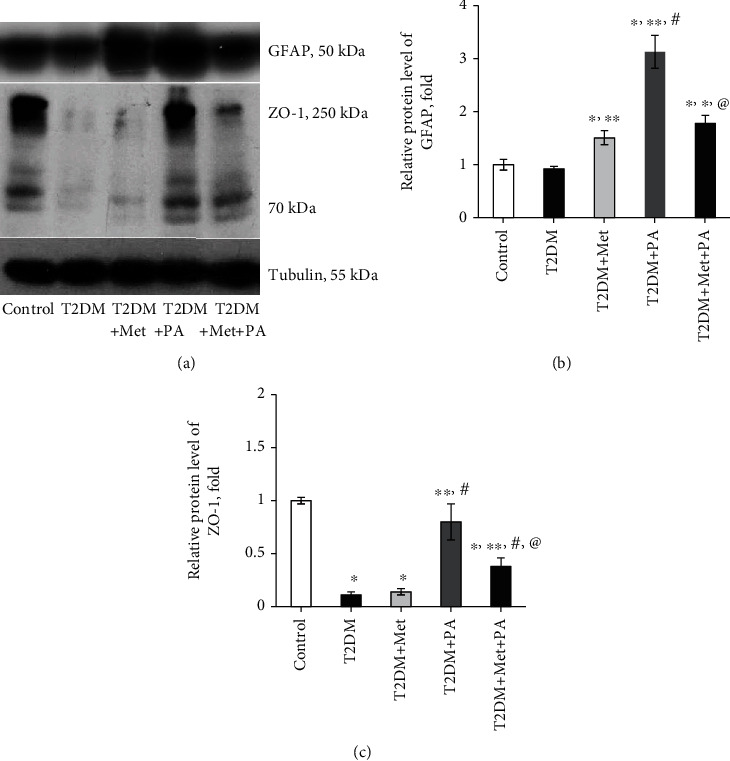
Figure 9.

Metformin and PA influence on the level of astrocytic marker GFAP and tight junction protein ZO-1. Immunoblotting analysis of GFAP and ZO-1 in rat VMH: (a) representative immunoblots are shown and quantified using tubulin as a loading control for hypothalamus lysates. The bar graphs of (b) GFAP and (c) ZO-1 protein levels are presented as means ± SEM (n =6/group). Data are shown as means ± SEM; ∗p < 0.05 vs. control, ∗∗p < 0.05 vs. T2DM, #p < 0.05 vs. metformin administration, and @p < 0.05 vs. PA administration.
