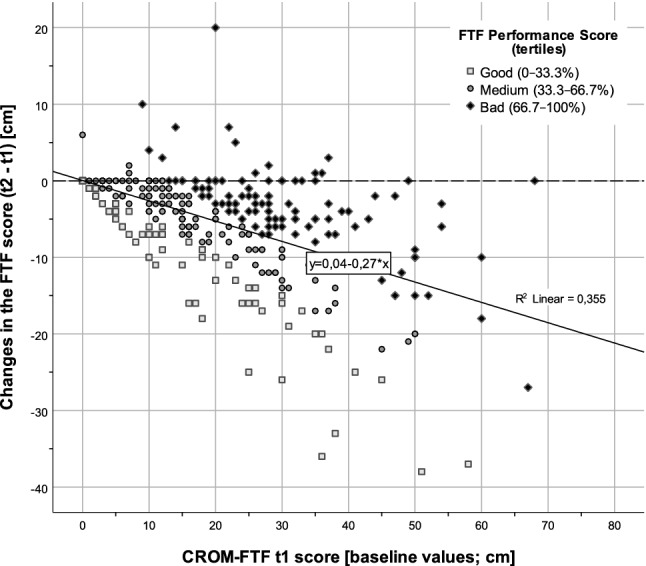
Fig. 1.

Baseline values (t1) and changes of CROM-FTF (t2 – t1). Changes of a Fingertip-To-Floor (FTF) test in relation to baseline values (t1) and the categorized performance score (t2 + Δ; tertiles highlighted in from and color). Tertiles were chosen because the expected and observed improvements in outcome measures (see Table 2) in inpatient rehabilitation are clearly visible in around 2/3 of patients [16]. Among the LBP patients, 73 had optimal values (0) for t1 and t2
