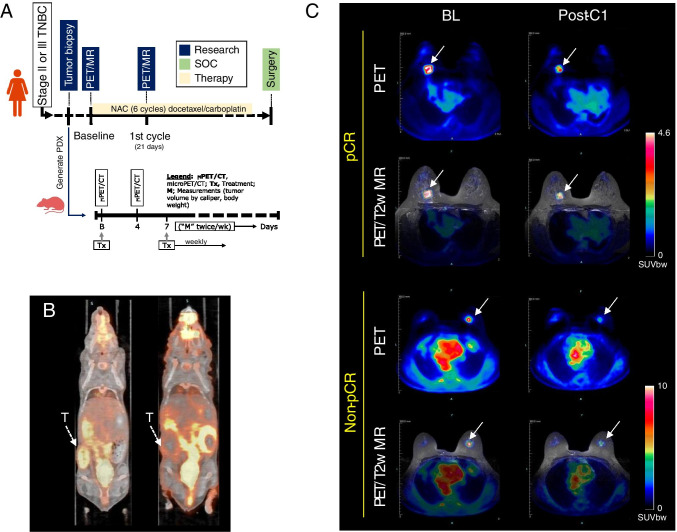
Fig. 2.
Co-clinical imaging. A Co-clinical imaging study design. Stage II or III TNBC patients were recruited into the study for 6 cycles of docetaxel/carboplatin therapy. Imaging timepoints are indicated on the timeline. PDX are generated from patient tumor biopsies to assess response to therapy with imaging at baseline and 4 days post-therapy. B Representative preclinical PET/CT and C clinical PET/MR images of response to therapy. Tumor is indicated by a white arrow

