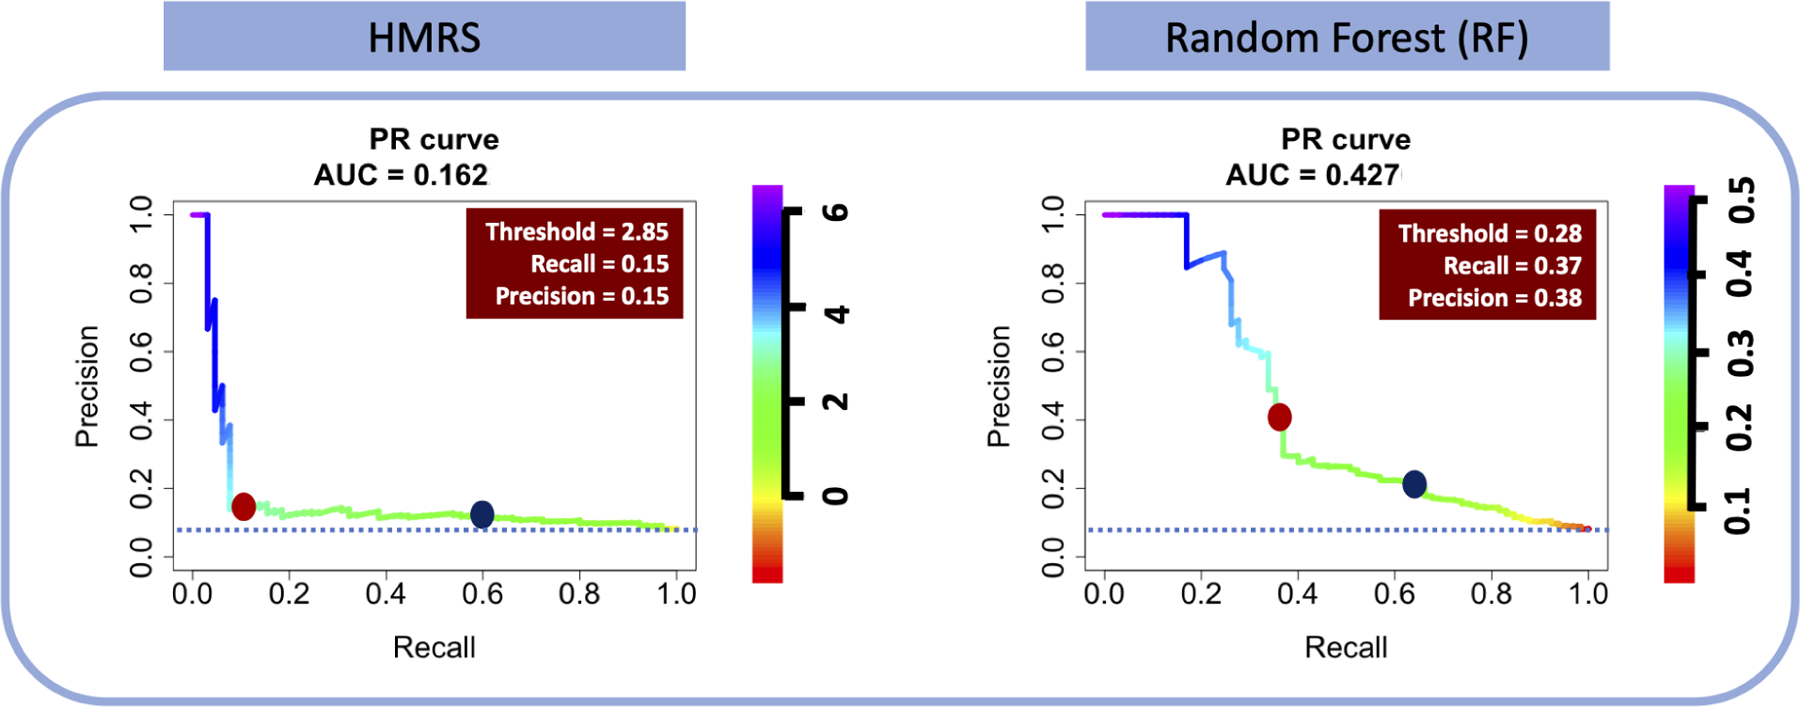
Figure 6:

The PRC for HMRS and RF classifiers- The dark blue point on the PRC curves are corresponding to optimized thresholds chosen based on the ROC curves in Figure 5A. The red boxes are the corresponding specifications of red dot points on PRC curves presenting the optimized cutoff thresholds of PRC curves.
