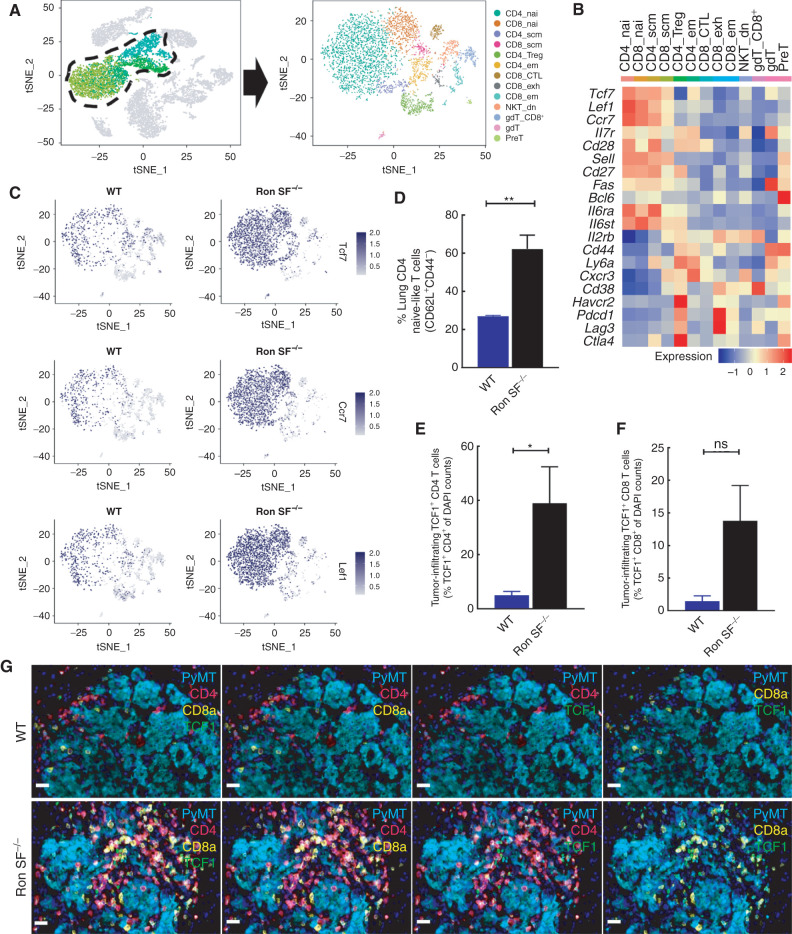
Figure 4.
Loss of SF-Ron alters the composition of tumor-infiltrating T cells. A, tSNE plot showing 13 T-cell clusters extracted from the combined data set. B, Heatmap showing the average expression of selected genes in each cluster that are linked to memory, self-renewal, activation, and inhibitory T-cell functions. C, tSNE plots showing the Tcf7, Ccr7, and Lef1 expression in tumor-infiltrating T cells of WT and Ron SF−/− lungs. D, Flow cytometry quantification of lung CD4 T cells presenting naïve-like phenotype. E and F, Quantification of metastatic tumor-infiltrating TCF1 expressing CD4 (E) or CD8 T cells (F). G, Representative images of PyMT lung metastases from WT and Ron SF−/− mice subjected to a five-marker multiplexed immunofluorescence stain to demonstrate the TCF1-expressing CD4 or CD8 T-cell infiltration into tumor. All scale bars correspond to 20 μm. Statistical analysis was performed by two-tailed unpaired Student t test, and error bars represents the SEM. CTL, cytotoxic T lymphocyte; dn, double-negative; em, effector memory; exh, exhausted; nai, naive; scm, stem cell memory. ns, P > 0.05; *, P ≤ 0.05; **, P ≤ 0.01; ***, P ≤ 0.001; ****, P ≤ 0.0001.

