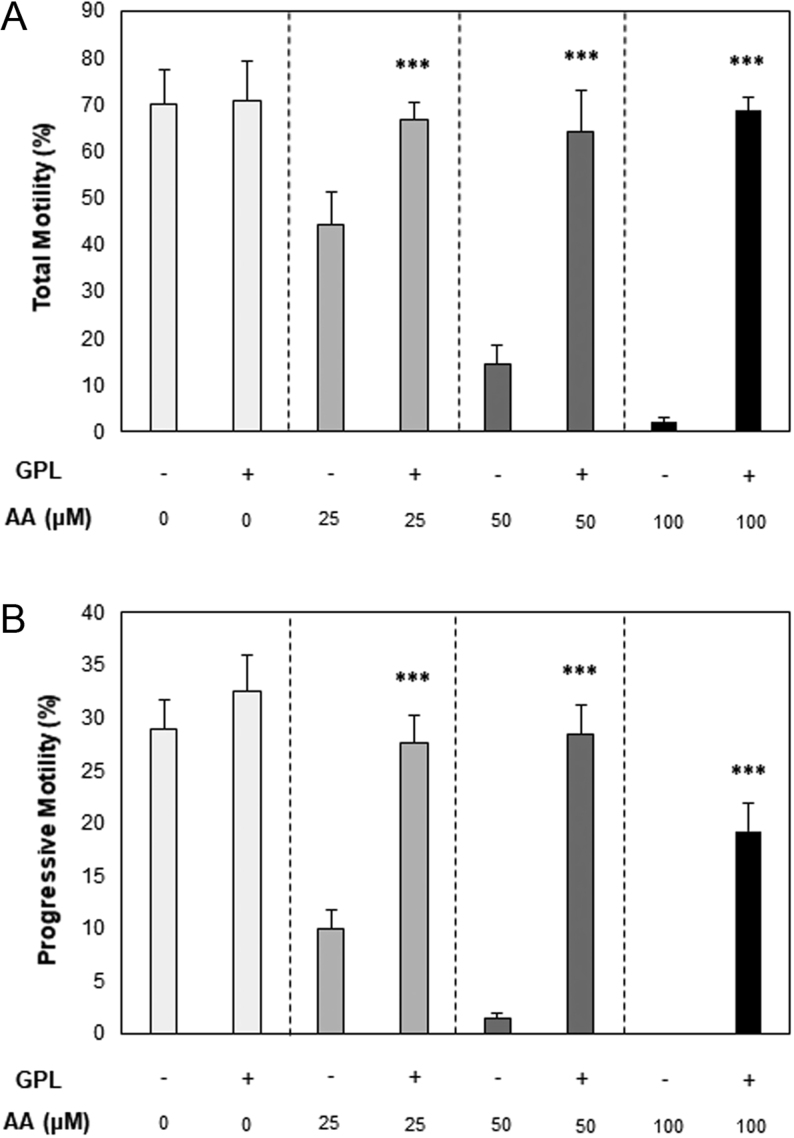
Figure 1.
Dose–response curves of total and progressive motility of stallion spermatozoa vs arachidonic acid (AA) concentration. (A) Total motility and (B) progressive motility of stallion spermatozoa, obtained after incubation in the presence of increasing concentrations of arachidonic acid only (AA; −) or in the presence of increasing concentrations of arachidonic acid with the addition of GPL (+). All data are displayed as means ± s.e.m. (***P ≤ 0.001; Student’s t-test was used for 0, 25 and 50 µM AA data; Wilcoxon signed rank test was used for 100 µM AA data).

 This work is licensed under a