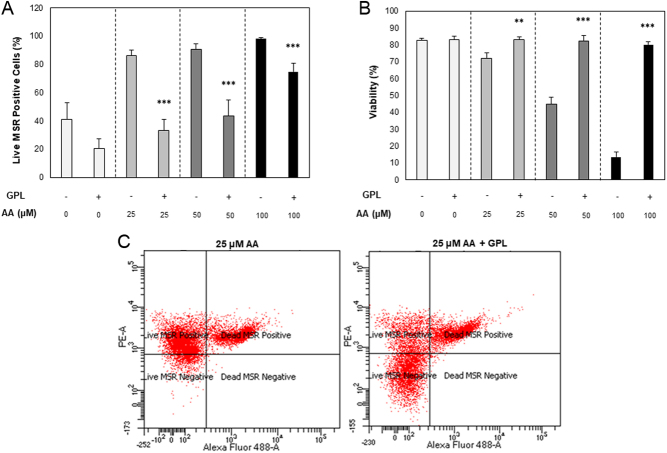
Figure 2.
Flow cytometric analysis of mitochondrial ROS within stallion spermatozoa. (A) Mitochondrial ROS levels measured by MitoSOX™ Red reagent (MSR), (B) Total cell viability measured with SYTOX™ Green Dead Cell Stain obtained after co-incubation in the presence of increasing concentrations of arachidonic acid only (AA; −) or in the presence of increasing concentrations of arachidonic acid with the addition of GPL (+), and (C) a representative flow cytometric dot plot depicting the fluorescent changes in spermatozoa after incubation with 25 µM AA (left) and 25 µM AA with the addition of GPL (right). All data are displayed as means ± s.e.m. (*P ≤ 0.05, **P ≤ 0.01, ***P ≤ 0.001; Student’s t-test).

 This work is licensed under a