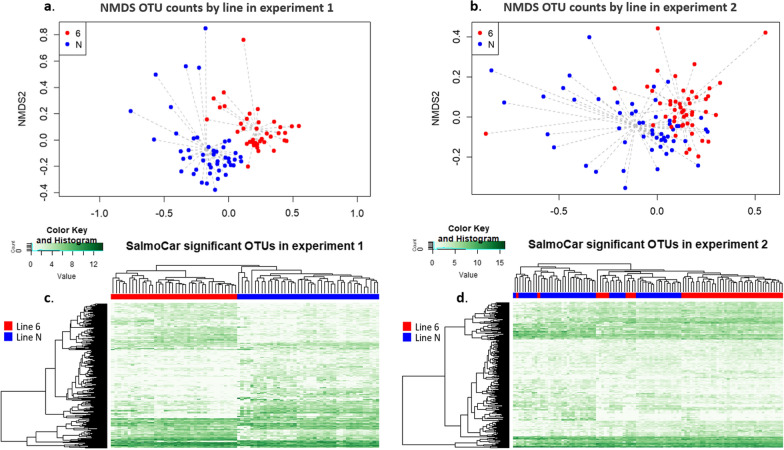
Fig. 5.
Non-metric multidimensional scaling representations and heatmaps comparing caecal microbiota composition between lines N and 61. Non-metric multidimensional scaling representations of the OTU composition of caecal contents using the Bray–Curtis dissimilarity. Comparison of composition between lines N and 61 in Experiment 1 (a) and Experiment 2 (b). A significant difference in microbiota composition is observed between lines after correction for isolator and sex effects (Permanova, P < 0.001). Heatmaps of the caecal OTU with differential abundances between lines N (in blue) and 61 (in red) in Experiment 1 (c) and in Experiment 2 (d)

