Fig. 6.
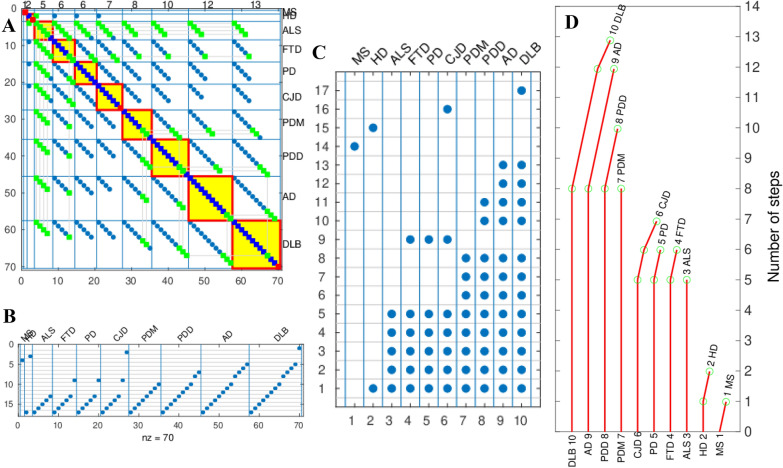
Calculation of the genealogy tree of the NDs for all data, male, female and non-annotated for sex data. A Spy of the matrix of adjacency matrix A that stores all possible combinations in which a step might be shared by a set of diseases [5] before sorting. Blue squares mark the steps in general. The green squares mark promoters of common steps. The promoters of common steps are marked only in the first disease where the step is found to be common but not in the remaining diseases sharing this common step. Promoter is the first common step found. Red squares mark the non-common steps. The red-bordered yellow squares mark the spy of the matrices used to position each ND on the tree of the genealogy of NDs. B Spy matrix of the steps in ordinates marked as blue points distributed across all possible steps shared by all NDs in abscissas. C Spy matrix of the steps in ordinates marked as blue points distributed across steps of each ND in abscissas. D Number of common and non-common steps calculated for each ND. The number of common steps of each ND is proportional to the length of the vertical red lines and the number of non-common steps is proportional to the length of the red deflection lines to the right. The number of steps is represented in the ordinates. Each ND has an associated ND index given in the spy matrix of C. The green circles mark the position of the steps that are non-common

