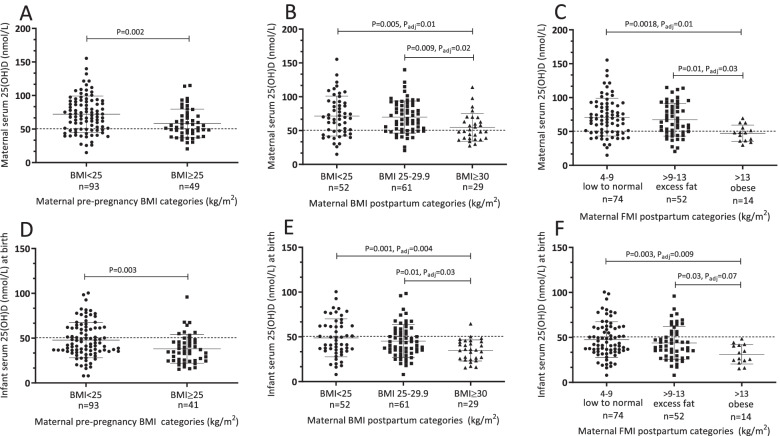
Fig. 1.
Maternal and neonatal serum 25(OH)D according to maternal BMI and FMI categories. Serum 25(OH)D concentrations of A mothers according to pre-pregnancy BMI categories (healthy: BMI < 25 or overweight/obese: BMI ≥25 kg/m2), B serum 25(OH)D concentrations of mothers according to postpartum BMI categories (healthy: BMI < 25, overweight: BMI 25-29.9, obese: BMI ≥30 kg/m2, C mothers according to their postpartum fat mass index (FMI) categories (low to normal: 4-9, excess fat: > 9-13, and obese: > 13 kg/m2). Serum 25(OH)D concentrations of infants at birth according to mothers, D pre-pregnancy BMI categories, E postnatal BMI categories and, F FMI categories. Data were compared using a linear fixed effects model, maternal pre-pregnancy, postpartum BMI and FMI as categorical fixed effects followed by post hoc Tukey’s tests with Tukey-Kramer adjustment for multiple comparisons. Data are mean ± SD

