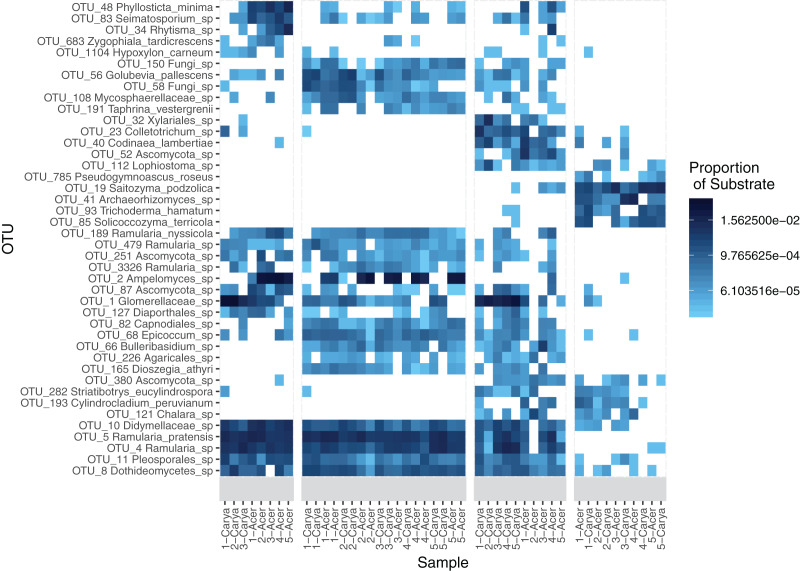
Figure 1. Heatmap of OTU abundance by substrate.
A total of 42 OTUs were included in the heatmap, all which were significant indicator taxa as determined using the multipatt function in the indicspecies package. Taxa names were determined using the CONSTAX2 classifier. Sample names are included beneath each column, with host species as either Acer rubrum (Acer) and Carya ovata (Carya) and site number designated in the name.

