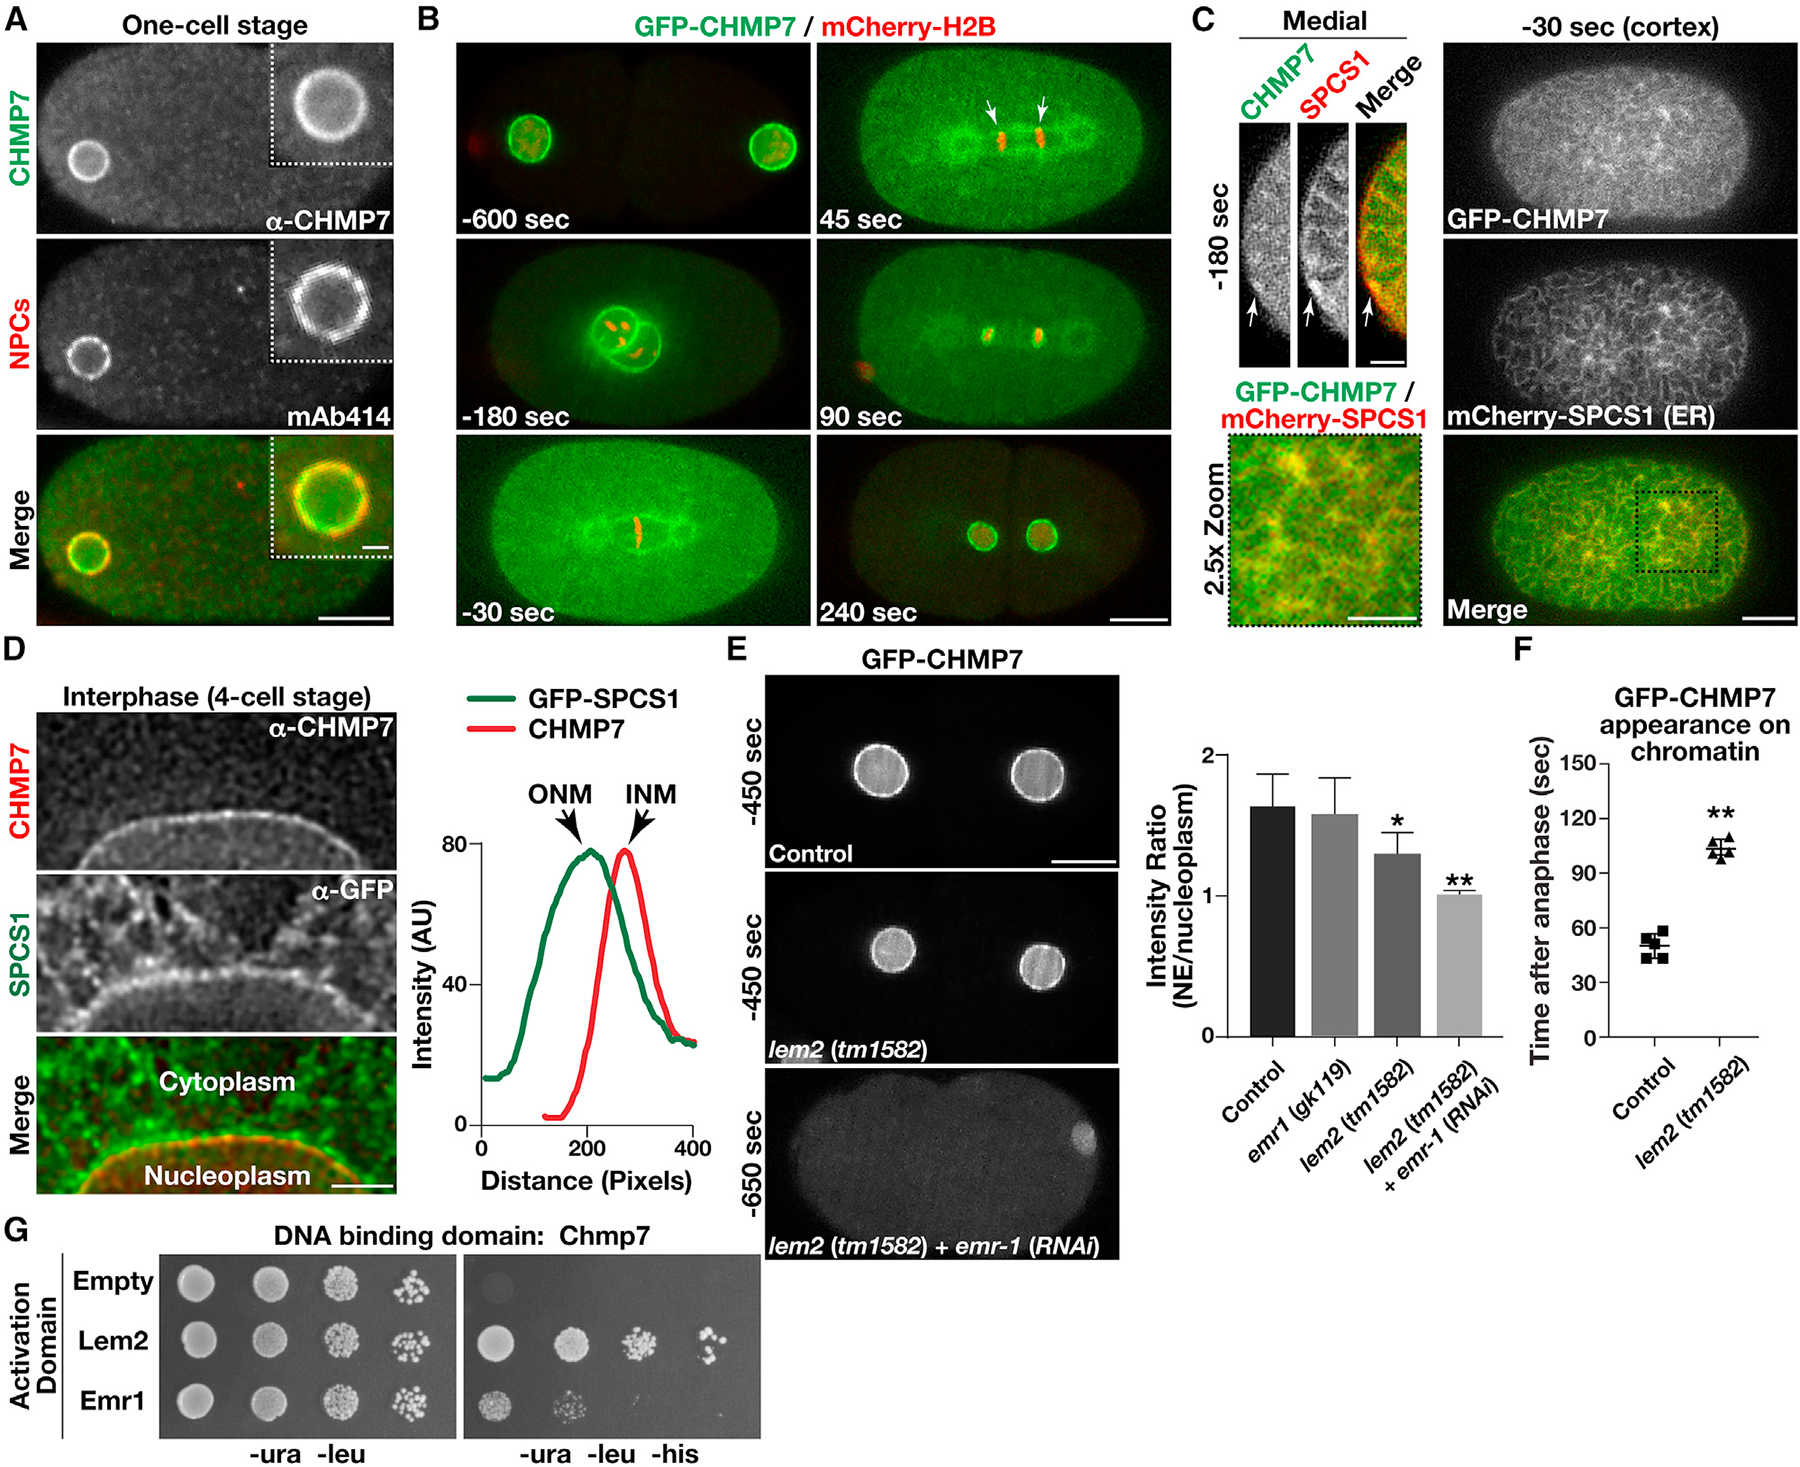
Figure 3. CHMP7 localizes to the inner nuclear membrane in a manner that depends upon multiple LEM domain proteins.

(A) Wild-type embryos were fixed and stained using antibodies directed against CHMP7 (green) and nuclear pore complexes (NPCs; recognized by monoclonal antibody mAb414; red) and imaged using confocal microscopy. Images are representative of more than 10 embryos analyzed. Bar, 10 μm; inset bar, 2 μm.
(B) Genome-edited embryos expressing native levels of a GFP fusion to CHMP7 (green) and a mCherry fusion to histone H2B (red) were imaged using time-lapse confocal microscopy (n = 10 animals). Time relative to anaphase onset is shown (bottom left of each image). Arrows highlight the initial concentration of CHMP7 on chromatin discs following anaphase onset based on line scan analysis. Bar, 10 μm.
(C) Genome-edited embryos expressing native levels of a GFP fusion to CHMP7 (green) and a mCherry fusion to the ER protein SPCS1 (red) were imaged using confocal microscopy (n = 10 animals). Representative cortical (right and bottom left) and medial (top left) sections are shown (time relative to anaphase onset). Bar (cortex), 10 μm; bar (medial), 5 μm; bar (2.5× zoom), 5 μm.
(D) Embryos expressing a GFP fusion to SPCS1 (ER marker) were fixed and stained using antibodies directed against CHMP7 (red) and GFP (green) and imaged using STED microscopy. Images are representative of more than 10 embryos analyzed. Line scan analysis was used to define the distribution of CHMP7 on the inner nuclear membrane (INM) relative to SPSC1, which is present on the outer nuclear membrane (ONM). Bar, 2 μm.
(E) Genome-edited embryos expressing native levels of a GFP fusion to CHMP7 (green) in the presence or absence of LEM domain proteins were imaged using confocal microscopy (left). Times indicated are relative to anaphase onset. The ratio of fluorescence intensities at the nuclear membrane as compared with the nucleoplasm is shown (right; prior to pronuclear meeting and before nuclear envelope (NE) structure is severely perturbed). Error bars represent mean ± SEM. **p < 0.01 and *p < 0.05, as compared with control, using an ANOVA with Dunnett’s test. Bar, 10 μm.
(F) The timing of CHMP7 accumulation on chromatin after anaphase onset is shown in control embryos and embryos lacking LEM2. Error bars represent mean ± SEM. **p < 0.01, as compared with control, using a t test.
(G) Yeast co-expressing plasmids encoding CHMP7 (bait fusion) and two distinct prey constructs were plated (10-fold dilutions, left to right) on either selective (−ura, −leu, −his) or histidine-supplemented medium for 72 h (n = 3).
See also Figures S1 and S2.
