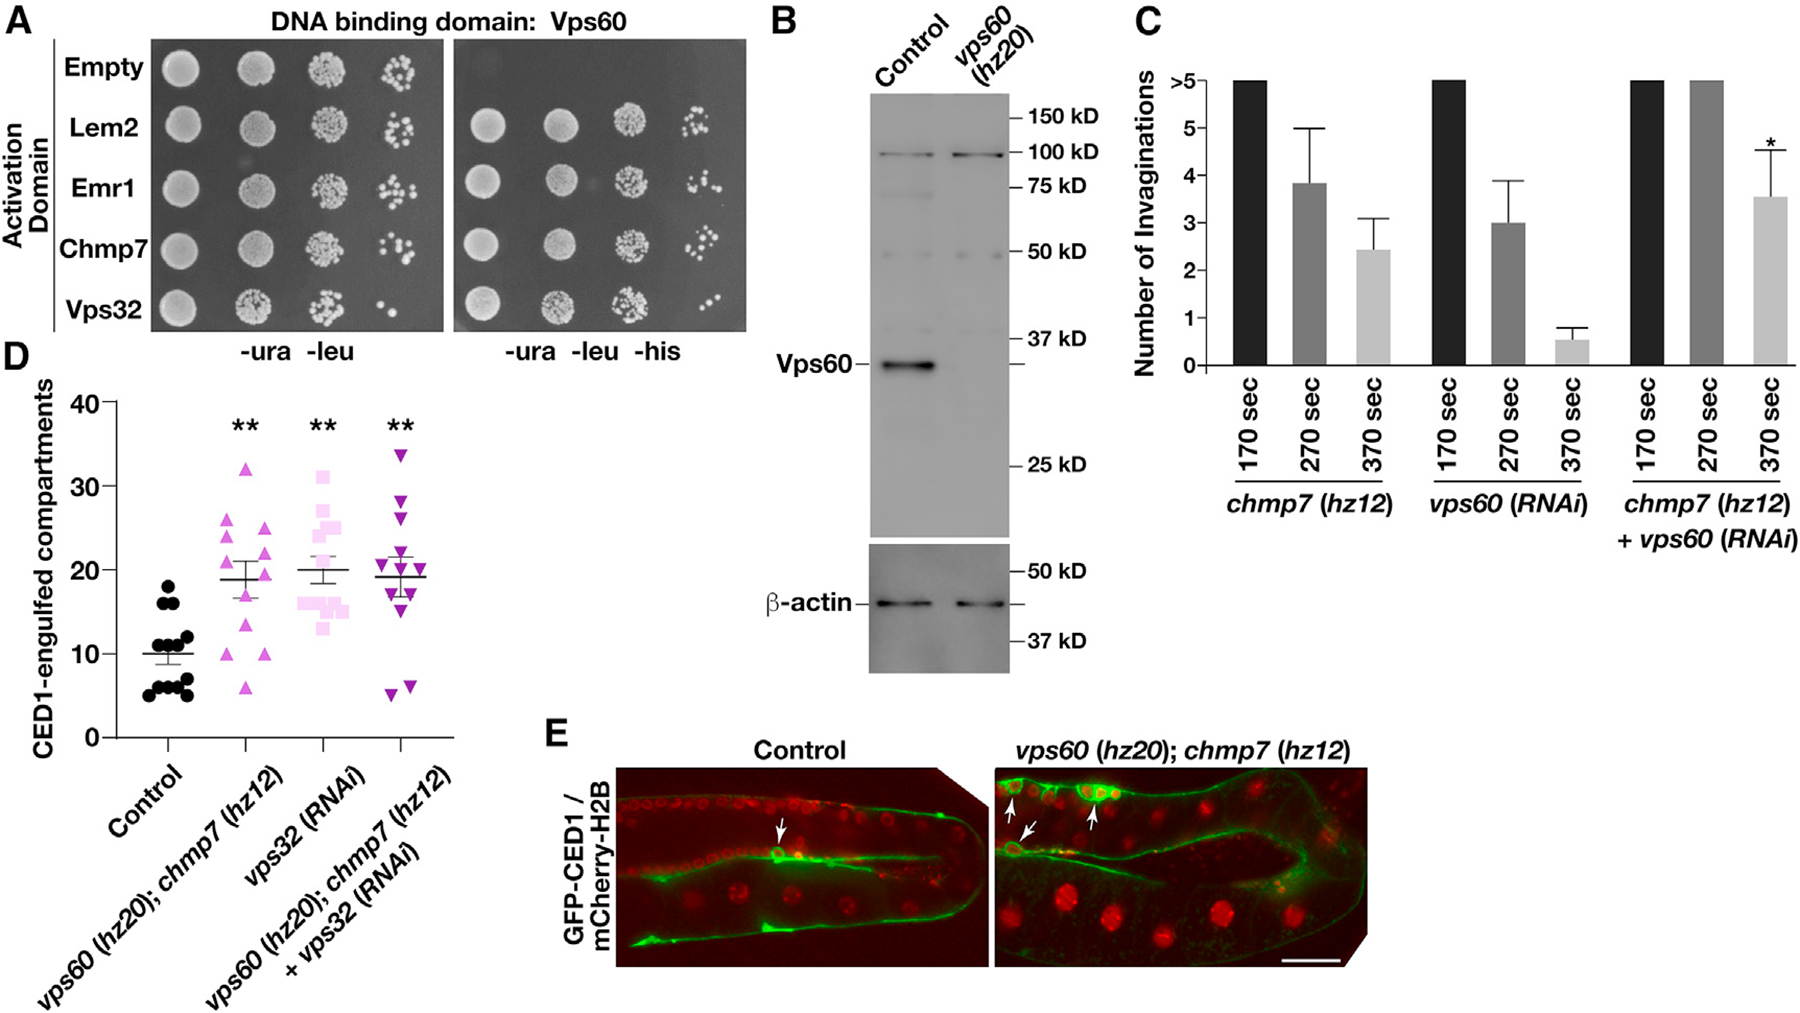
Figure 7. Inhibition of ESCRT-III function leads to an increase in germline apoptosis.

(A) Yeast co-expressing plasmids encoding VPS60 (bait fusion) and different prey constructs as indicated were plated (10-fold dilutions, left to right) on either selective (−ura, −leu, −his) or histidine-supplemented medium for 72 h (n = 2). In all cases, constructs were shown not to promote auto-activation.
(B) Representative immunoblot of extracts generated from control and vps60 (hz20) mutant animals (n = 2 each) using antibodies directed against VPS60 (top) and beta-actin (bottom; load control).
(C) The number of nuclear membrane invaginations was quantified during NE expansion in embryos lacking CHMP7 and/or VPS60. Time shown is relative to anaphase onset. Error bars represent mean ± SEM. *p < 0.05, as compared with single mutants at an identical time point after anaphase onset, using an ANOVA with Dunnett’s test.
(D and E) The germlines of animals co-expressing a GFP fusion to CED1 and a mCherry fusion to histone H2B were imaged in the presence and absence of different ESCRT-III subunits. Quantification of the number of CED1-positive compartments (D) and representative images (E) are shown. Error bars represent mean ± SEM. **p < 0.01, as compared with control, using an ANOVA with Tukey’s test. Bar, 50 μm.
See also Figure S3.
