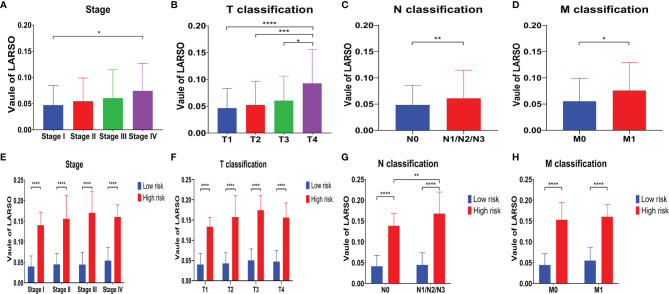
Figure 3.
Correlation analysis between the LARSO value and stage or TNM stage. (A) Tumor stage was negatively correlated with LARSO value, i.e., higher stage, lower LARSO value; the difference of LARSO between stage I and stage IV was statistically significant (P < 0.05). (B) A higher LARSO value was associated with a worse T stage. The LARSO value at T1, T2, or T3 was statistically different from the LARSO value at T4. (C) The LARSO value of patients with lymph node metastasis (N1/N2/N3) was significantly higher than patients without lymph node metastasis (N0). (D) LARSO value in the M0 group was significantly lower than that in the M1 group (P < 0.05). (E) The LARSO value between the high- and low-risk groups at different stages was statistically significant, and the LARSO value of the high-risk group was significantly higher than that of the low-risk group (P < 0.05). (F) The LARSO value in different T stages between the high- and low-risk groups was statistically significant. (G) The LARSO value between the high- and low-risk groups was significantly different in various N stages (P < 0.05). In addition, the LARSO value in the high-risk group with lymph node metastasis (N1/N2/N3) was significantly higher than that in the non-lymph node metastasis group (N0). (H) The difference of LARSO value in different M stages in the high- and low-risk groups was statistically significant. Student’s t-test was used for testing between groups. *P < 0.05; **P < 0.01; ***P < 0.001; ****P < 0.0001.

