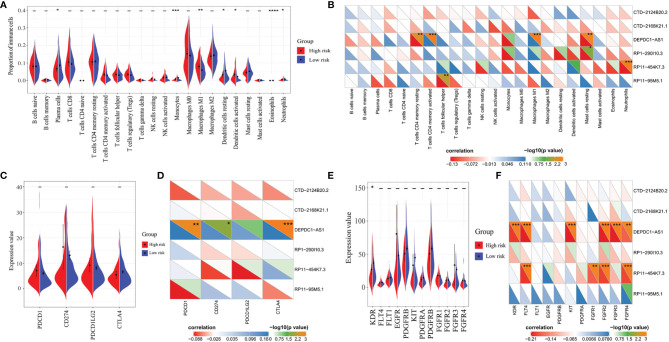
Figure 6.
Correlation analysis of lncRNAs with immune cell infiltration score, immune checkpoint expression, or antivascular target expression between the high- and low-risk groups. (A) Significant immune infiltrates between the two groups: plasma cells (P = 0.0233), monocytes (P = 0.0003), macrophages M1 (P = 0.0013), dendritic cells resting (P = 0.0269), dendritic cells activated (P = 0.0294), eosinophils (P < 0.0001), and neutrophils (P = 0.0256). (B) Correlation analysis between lncRNAs in the prognostic model and immune infiltration score. (C) Correlation analysis of four immune checkpoints (PD-1, PD-L1, PD-L2, and CTLA4) between the high- and low-risk groups; no significant difference was found. (D) Correlation analysis between immune checkpoints with the six lncRNAs. (E) Correlation analysis of common anti-angiogenic targets between the high- and low-risk groups. Only KDR (VEGFR-2) showed a significant difference between the two groups (P = 0.0314). (F) Correlation analysis between anti-angiogenic targets with the six lncRNAs. Student’s t-test was used for the different tests between groups. Correlation analysis was performed by the Spearman test. *P < 0.05; **P < 0.01; ***P < 0.001; ****P < 0.0001.

