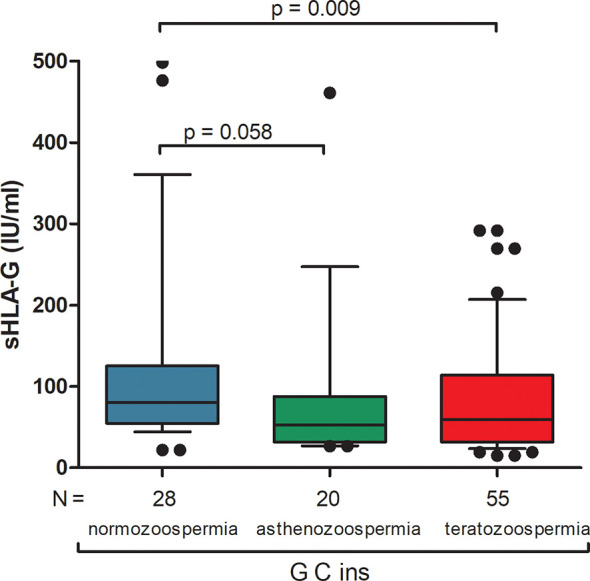
Figure 2.

Concentration of soluble HLA-G per milliliter of plasma (IU/ml) measured in semen samples of G-C-ins haplotype carriers. Haplotype was estimated in the following order: rs1632947:−964G>A; rs1233334:−725G>C/T; rs371194629:insATTTGTTCATGCCT/del. Blue box represents the level of sHLA-G measured in normozoospermic men, green box – in men with asthenozoospermia, red box – in men with teratozoospermia. Boxes are drawn from the first quartile (25th Percentile) to the third quartile (75th Percentile). Black lines in boxes are medians. Whiskers represent 10-90 percentiles. N is the number of patients. P-values are calculated by Mann-Whitney test.
