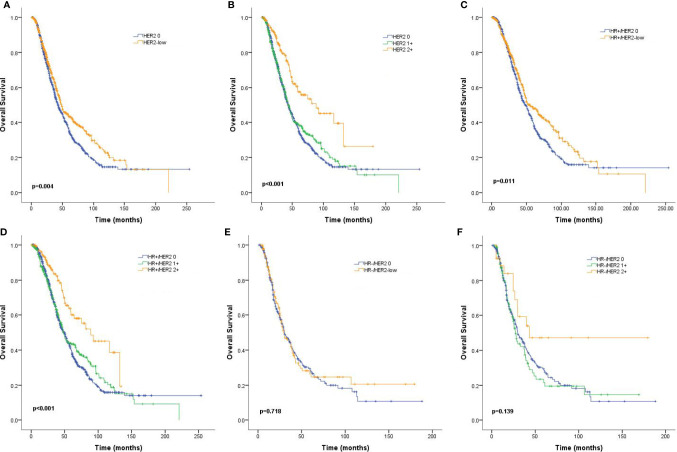
Figure 3.
Kaplan–Meier curves for overall survival (OS) by hormone receptor (HR) status and human epidermal growth factor receptor 2 (HER2) immunohistochemistry (IHC) status. OS for HER2-low vs. HER2-zero tumors in the complete cohort (A), HR-positive population (C), and HR-negative population (E), as well as OS curves for HER2 2+ vs. HER2 1+ vs. HER2-zero tumors for the complete cohort (B), HR-positive population (D), and HR-negative population (F). p values are from the stratified log-rank test.

