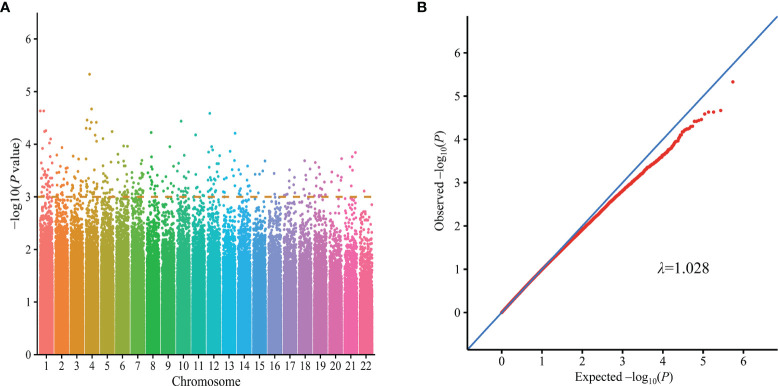
Figure 2.
GWAS results on silicosis in Han Chinese population (155 cases and 141 controls). Manhattan plots represent -log10 (p-value) for SNPs distributed across all chromosomes (A), and quantile-quantile (Q-Q) plot described the distribution of the observed (y-axis) and expected (x-axis) p-values of each SNPs (B). Q-Q, quantile-quantile; GWAS, Genome-wide association study.

