Figure 2.
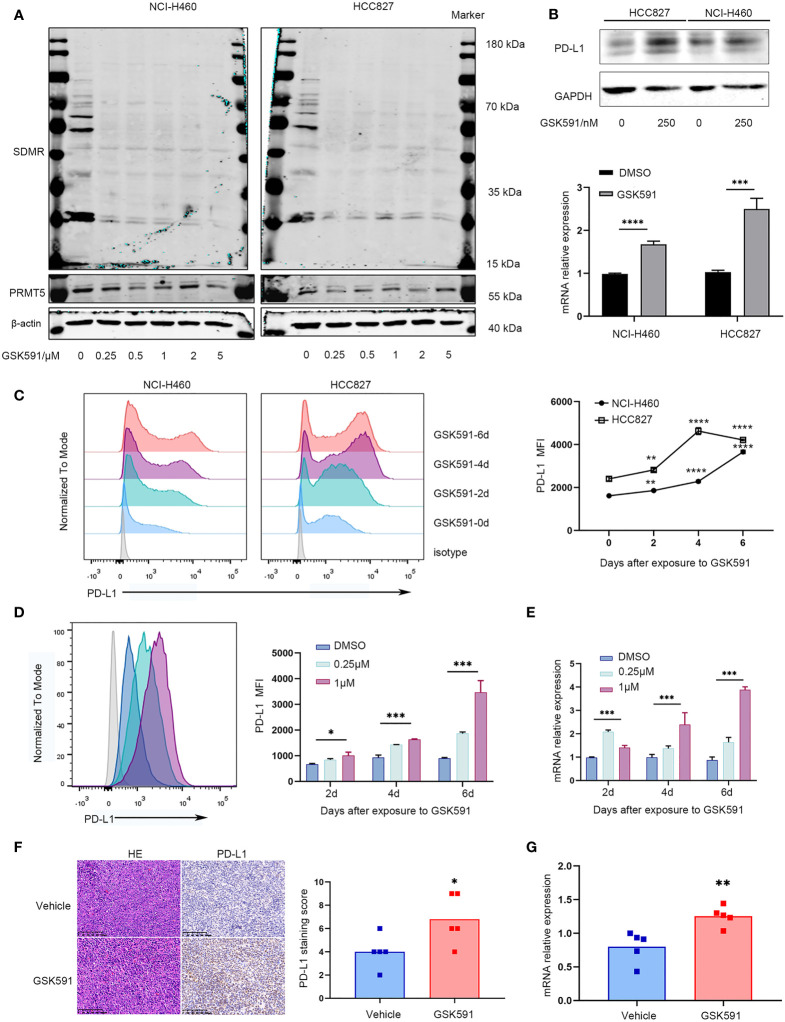
PRMT5 inhibition leads to upregulation of PD-L1 in vitro and in vivo. (A) NCI-H460 and HCC827 cells were cultured in the presence or absence of a PRMT5-inhibiting molecule (GSK591) at the indicated concentrations for 4 days. Western blot analysis of NCI-H460 cells (left) and HCC827 cells (right) (symmetric dimethylated arginine sDMR and PRMT5 expression; β-actin served as loading control. One of three similar results is shown. (B) NCI-H460 and HCC827 cells were cultured in the presence or absence of 250 nM GSK591, and PD-L1 expression was measured by Western blot analysis (top) and CD274 expression by qPCR (bottom) after 4 days. Data are the means ± SEM of three independent experiments. Statistical differences were determined by a two-tailed unpaired Student’s t test, ***p < 0.001, ****p < 0.0001. (C) NCI-H460 and HCC827 cells were cultured in the presence or absence of 250 nM GSK591, and PD-L1 expression was analyzed by flow cytometry on days 0, 2, 4, and 6. Data represent the mean fluorescence intensity (MFI). One of three similar results is shown. (D, E) LLC cells were treated in the presence or absence of GSK591 at the indicated concentrations; PD-L1 expression was determined on days 2, 4, and 6 by flow cytometry (D) and qPCR (E). Data represent the mean fluorescence intensity (MFI) and Cd274 mRNA normalized to Actb. (F, G) Nude mice bearing LLC tumors were treated with GSK591 (50 mg/kg) or vehicle (n = 5/group) for 12 days. PD-L1 protein expression was measured by histochemistry (F), and Cd274 mRNA expression was measured by qPCR (G). Representative HE and IHC images for PD-L1 expression of the tumor sections from the vehicle and GSK591-treated groups are shown. Scale bar = 100 μm. Means ± SEM are plotted. *p < 0.05, **p < 0.01, *** p < 0.001, ****p < 0.0001.

