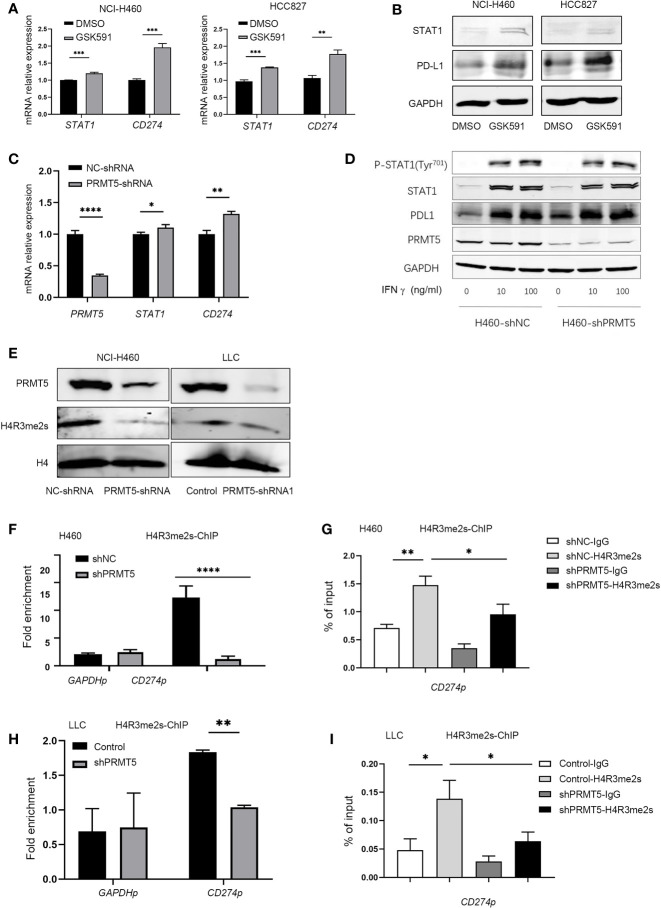
Figure 3.
Inhibition of PRMT5 upregulates PD-L1 expression through symmetric dimethylation of H4R3. (A, B) NCI-H460 and HCC827 cells were cultured in the presence or absence of 250 nM GSK591 for 4 days, and STAT1 and CD274 transcripts were measured by qPCR (A). Data are the means ± SEM of three independent experiments. Statistical differences were determined by a two-tailed unpaired Student’s t test, **p < 0.01, ***p < 0.001. STAT1 and PD-L1 expressions were detected by Western blot analysis and GAPDH served as a loading control (B); one of three similar results are shown. (C) PRMT5 was knocked down in NCI-H460 cells, and STAT1 and CD274 mRNA expression was determined by qPCR. Data are the means ± SEM of three independent experiments. Statistical differences were determined by two-tailed unpaired Student’s t test, *p < 0.05, **p < 0.01, ***p < 0.001. (D) NC-shRNA- and PRMT5-shRNA-treated NCI-H460 cells were stimulated with recombinant human IFNγ at the indicated concentrations for 12 h. Total and phosphorylated STAT1, PD-L1, and PRMT5 were analyzed by Western blot analysis. GAPDH served as a loading control. (E) Immunoblot of H4R3 me2s in NCI-H460 and LLC cells after PRMT5 was knocked down; H4 served as a loading control. One of three similar results is shown. (F, G) PRMT5 was knocked down in NCI-H460 cells, and ChIP qPCR was performed to determine H3R2 me2s binding to the CD274 promoter locus (CD274p) in NCI-H460 shPRMT5 cells compared with shNC cells. IgG or anti-H4R3 me2s antibodies were utilized in the chromatin immunoprecipitation assay. Fold enrichment was calculated as the H4R3 me2s signal/IgG signal for each sample (F). The GAPDH promoter locus (GAPDHp) was utilized as a negative control. qRT-PCR values from IgG and H4R3 me2s were normalized by the input qRT-PCR values (G). Data are the means ± SEM of three independent experiments. Statistical differences were determined by a two-tailed unpaired Student’s t test, *p < 0.05, **p < 0.01, ***p < 0.001, ****p < 0.0001. (H, I) PRMT5 was knocked down in LLC cells, and ChIP qPCR was performed to determine H4R3 me2s binding to the CD274 promoter locus (CD274p) in LLC shPRMT5 cells compared with control cells. IgG or anti-H4R3 me2s antibodies were utilized in the chromatin immunoprecipitation assay. Fold enrichment was calculated as the H4R3 me2s signal/IgG signal for each sample (H). The GAPDH promoter locus (GAPDHp) was utilized as a negative control. qRT-PCR values from IgG and H4R3 me2s were normalized by the input qRT-PCR values (I). Data are the means ± SEM of three independent experiments. Statistical differences were determined by a two-tailed unpaired Student’s t test, *p < 0.05, **p < 0.01.

