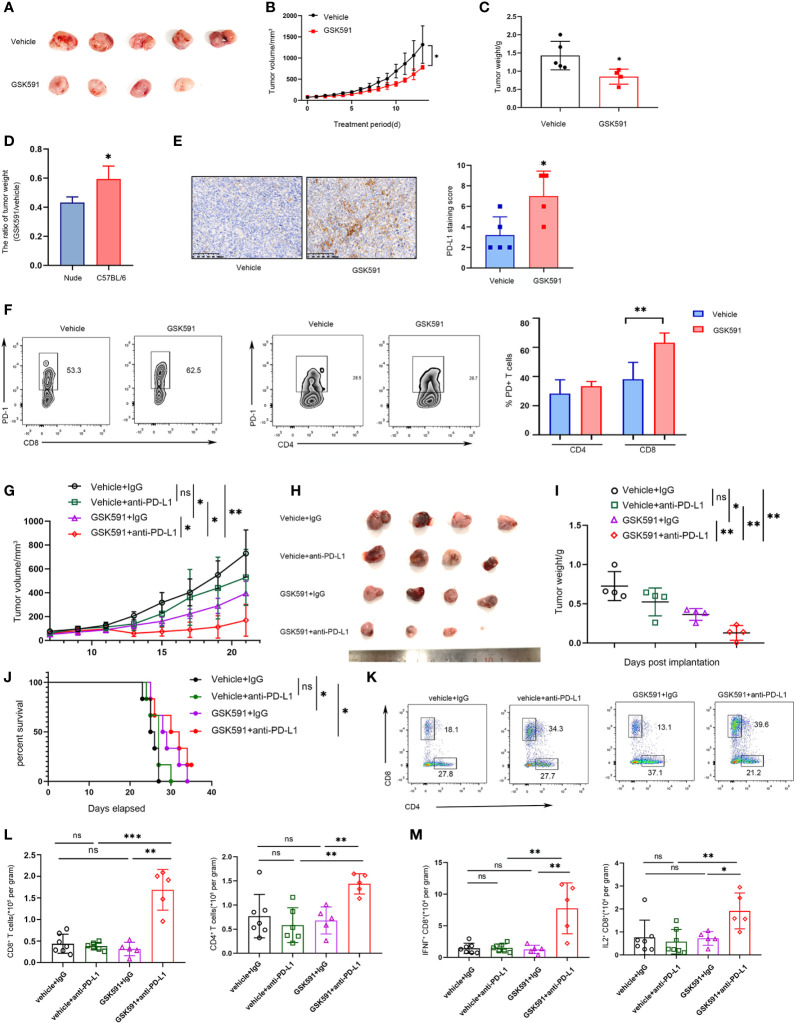
Figure 5.
Combined PRMT5 inhibition and anti-PD-L1 antibody enhances antitumor activity. (A–D) C57BL/6 mice bearing LLC tumors were treated with GSK591 (50 mg/kg) or vehicle (n = 5/group) for 12 days. Images of resected tumors (A), tumor growth curves (B), and tumor weights (C) are shown. The tumor weight ratio of GSK591 treated with vehicle in C57BL/6 mice and nude mice (D). One of three similar results is shown. Bar graph shows the means ± SEM of three independent experiments. Statistical differences were determined by a two-tailed unpaired Student’s t test, *p < 0.05. (E) PD-L1 expression was determined by IHC in GSK591 or the vehicle-treated group. Statistical differences were determined by a two-tailed unpaired Student’s t test, **p < 0.01. (F) PD1 expression was determined in infiltrated CD8T and CD4T cells by flow cytometry. Statistical differences were determined by a two-tailed unpaired Student’s t test, **p < 0.01. (G–J) C57BL/6 mice bearing LLC tumors were treated with IgG (10 mg/kg), anti-PD-L1 (10 mg/kg), and GSK591 (50 mg/kg) or the combination (n = 4 per group). Tumor volumes (G), images of resected tumor tissues (H), tumor weights (I), and survival of mice (J) are shown. Statistical differences were determined by a two-tailed unpaired Student’s t test, *p < 0.05, *p < 0.01. For the survival curve, the p value was established by the Mantel–Cox test. (K, L) Flow cytometry analysis of tumor infiltrating CD8 T and CD4T cells after anti-PD-L1 and GSK591 treatment. Representative plots are shown (K). Bar graph shows the means ± SEM (L). Statistical differences were determined by a two-tailed unpaired Student’s t test, **p < 0.01, ***p < 0.001, ns—no significant. (M) IFNγ and IL-2 expressions in tumor-infiltrating CD8 T cells were analyzed by flow cytometry. Bar graph shows the means ± SEM. Statistical differences were determined by a two-tailed unpaired Student’s t test, *p < 0.05, **p < 0.01, ns, not significant.

