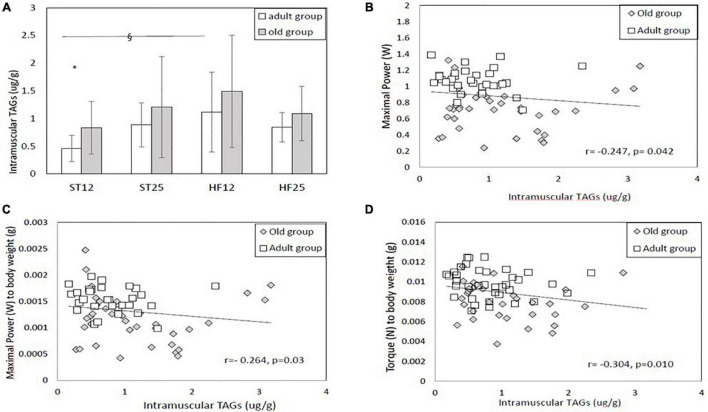
FIGURE 2.
(A) Intramuscular triacylglycerols (TAGs). § Diet effect (same age) in the adult group, HF12 vs. ST12, p = 0.022. *Age effect (same diet): ST12 groups, p = 0.030. Adult rats: ST12 (n = 12); ST25 (n = 12); HF12 (n = 12); HF25 (n = 11). Old rats: ST12 (n = 11); ST25 (n = 11); HF12 (n = 9); HF25 (n = 7). (B–D) Correlations between intramuscular TAGs and maximal power, maximal power to body weight ratio, and maximal isometric torque to body weight ratio.

