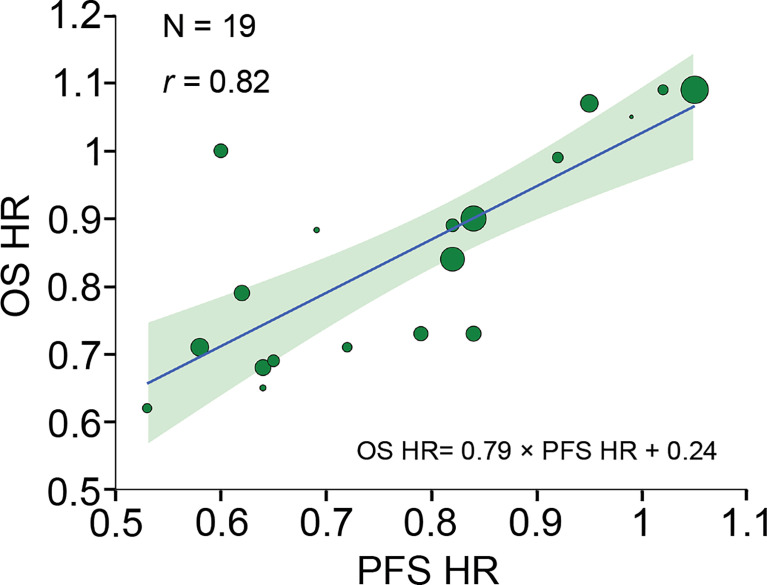
Figure 2.
Trial-level correlation between PFS HR and OS HR. Circle size is proportional to the number of patients included in each comparison. The solid blue line indicates the fitted weighted linear regression line; the light green zone represents its 95% CI; r indicates the correlation coefficient. PFS, progression-free survival; OS, overall survival; HR, hazard ratio; CI, confidence interval.

