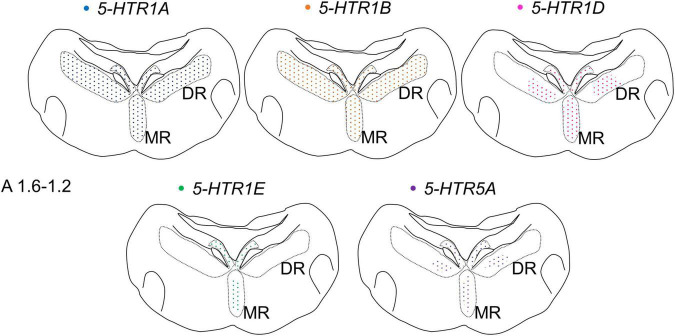
FIGURE 10.
Schematic summary of the expression patterns of 5-HTR1A, 5-HTR1B, 5-HTR1D, 5-HTR1E, and 5-HTR5A in the DR and MR in the P1 chick brainstems. Representative expression patterns in sections around A 1.6. A 1.2 are exhibited in colored areas (blue, 5-HTR1A; orange, 5-HTR1B; magenta, 5-HTR1D; green, 5-HTR1E; purple, 5-HTR5A). The dotted pattern indicates that the expressed cells are sparsely distributed. The levels of the sections are in accordance with those mentioned in Kuenzel and Masson’s chick atlas (Kuenzel and Masson, 1988). DR, dorsal raphe; MR, median raphe; P1, post-hatch day 1.

