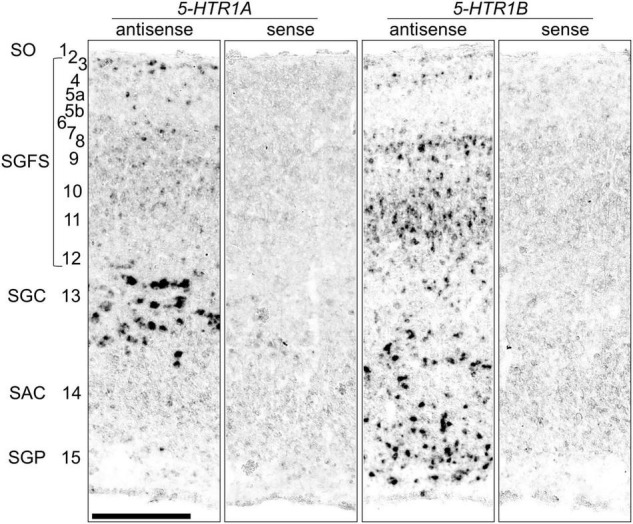
FIGURE 4.

Comparison of the 5-HTR1A and 5-HTR1B expression patterns in the optic tectum in the P1 chick brainstem sections. Magnified views of the regions of the optic tectum to compare layers of 5-HTR1A-expressing and 5-HTR1B-expressing areas. Numbers represent tectal layers according to Ramón y Cajal (1911). The leftmost alphabetical system of nomenclature is in accordance with that mentioned in Kuenzel and Masson’s chick atlas (Kuenzel and Masson, 1988). SAC, stratum album centrale; SGC, stratum griseum centrale; SGFS, stratum griseum et fibrosum superficiale; SGP, stratum griseum periventriculare; SO, stratum opticum; P1, post-hatch day 1. Scale bars = 250 μm.
