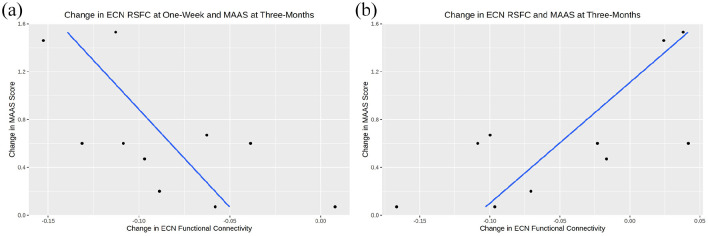
Figure 4.
Correlations between executive control network (ECN) connectivity and mindful attention awareness scale (MAAS). Scatter plots with linear regressions between MAAS score (y-axis) and (a) change in ECN connectivity at 1 week, and (b) change in ECN connectivity at 3 months. Blue lines represent lines of best fit and black dots denote observed data.

