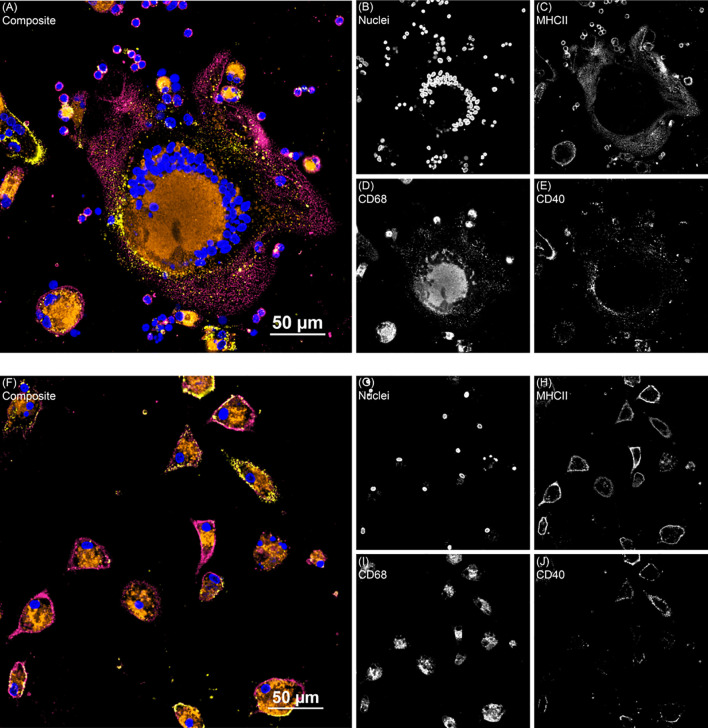
Figure 5.
Two representative fluorescence images from the monocyte derived macrophage activation marker experiment. (A) Shows giant cell formation from a subclinical cow MDM sample treated with 25(OH)D3 and (F) shows clinical cow untreated MDMs. Composite images show all channels. (B, G) DAPI counterstain was used to detect nuclei (blue) and was excited on the 405 nm laser. (C, H) MHCII (magenta) was labeled with an AF488 secondary antibody and excited with the 488 nm laser. (D, I) CD68 (orange) was labeled with an AF594 secondary antibody and excited on the 561 nm laser. (E, J) CD40 (yellow) was labeled with a NeutrAvidin DyLight 650 tertiary antibody and excited on the 640 nm laser.

