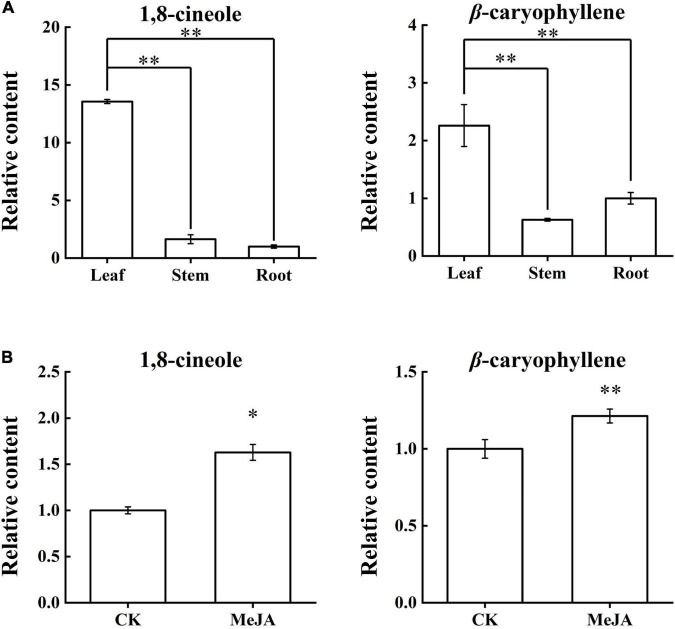
FIGURE 5.
Content changes of 1,8-cineole and β-caryophyllene in the LSR group and the MeJA group. (A) Relative contents of 1,8-cineole and β-caryophyllene in the LSR group. (B) Relative contents of 1,8-cineole and β-caryophyllene in the MeJA group. The values represent means ± SD (n = 3). * Means p-value < 0.05, and ** means p-value < 0.01.

