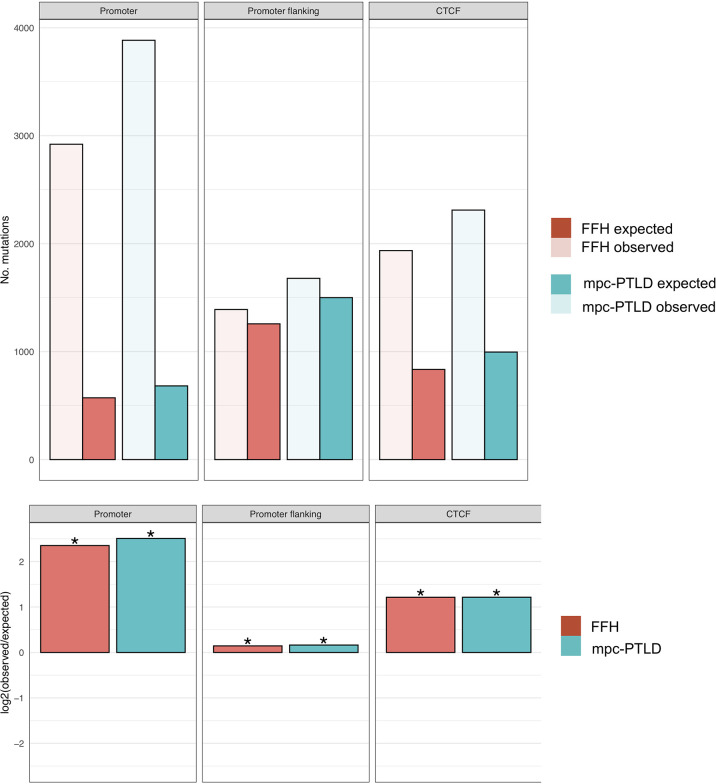
Figure 5.
Enrichment analysis for promoter region, promoter flanking regions, and transcription binding sites (CTCF). The top part of the figure shows the observed versus expected number of mutations. In the bottom part of the figure, the mutational burden within the same non-coding gene regions for both groups are demonstrated as the log2 ratio of the number of observed and expected point mutations indicating the effect size of the enrichment or depletion within each region. (*) = statistical significance (p<0.05; two‐sided binomial test).

