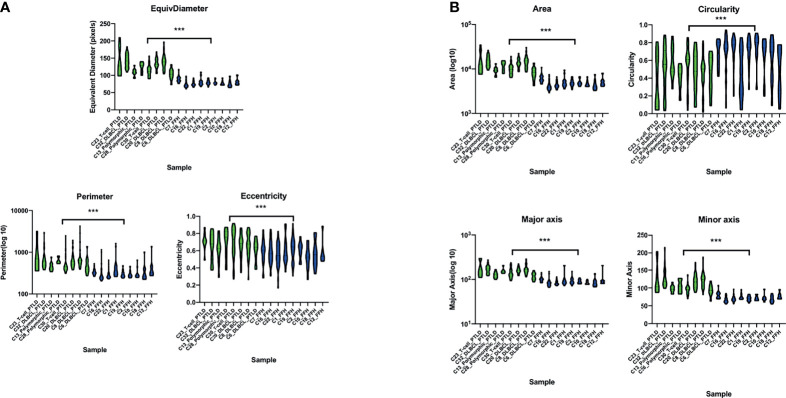
Figure 8.
Violin plot of the digital imaging analysis of M-PTLD, P-PTLD, CHL-PTLD, and FFH-PTLD cases. (A) Violin plots of cellular parameters of equivalent diameter, perimeter and eccentricity. (B) Violin plots of cellular parameters of area, circularity, major axis, and minor axis. Displayed are nine representative samples of each group. Green represents M-PTLD and P-PTLD cases, blue indicates FFH-PTLD cases. (***) = statistical significance (p<0.0001).

