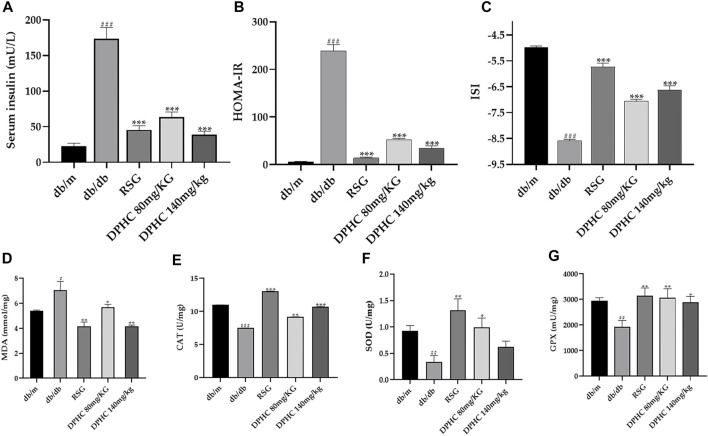
FIGURE 4.
Effect of DPHC on serum insulin level and antioxidant enzymes of liver tissues in db/db mice. (A) Serum insulin. (B) HOMA-IR. (C) ISI. (D) MDA. (E) CAT. (F) SOD. (G) GSH-Px. All values are expressed as means ± SD, n = 9. *p < 0.05, **p < 0.01, ***p < 0.001 compared with the db/db group, and ## p < 0.01, ### p < 0.001 compared with the db/m group.

