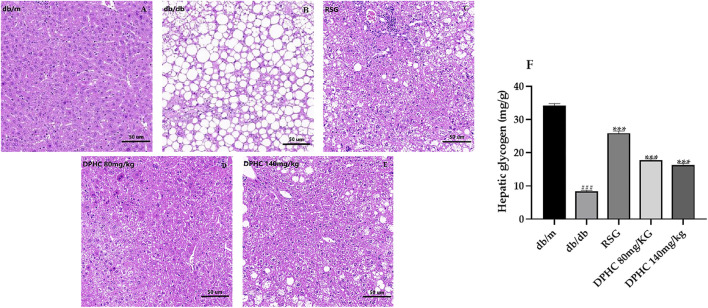
FIGURE 5.
Effects of DPHC on liver tissue histopathological changes and hepatic glycogen contents in db/db mice. (A–E) Histopathological changes in the livers of mice. Magnification is 200×. (F) Liver glycogen levels in mice. All values are expressed as means ± SD, n = 9. ***p < 0.001 compared with the db/db group, and ### p < 0.001 compared with the db/m group.

