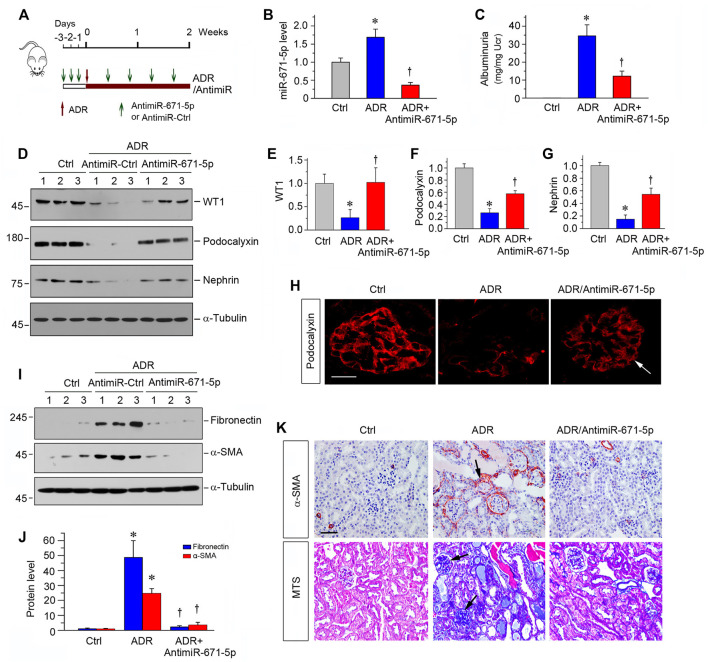
FIGURE 6.
Inhibition of miR-671-5p reduces proteinuria and renal fibrotic lesions in ADR nephropathy. (A) Experimental design. Red Arrows indicate the time of ADR injection. Green arrows indicate the different time points of antagomir injections. (B) qRT-PCR analysis shows that miR-671-5p level was increased in ADR group compared with control, and injections of antimiR-671-5p decreased miR-671-5p level. *p < 0.05 versus normal controls; †p < 0.05 versus ADR (n = 5–6). (C) Inhibition of miR-671-5p reduces proteinuria in ADR nephropathy. Urinary albumin levels were assessed in mice at 2 weeks after ADR injection and expressed as mg/mg creatinine. *p < 0.05 versus normal controls; †p < 0.05 versus ADR (n = 5–6). (D–G) Representative Western blots (D) and graphic presentations of WT1 (E), podocalyxin (F) and nephrin (G) were presented. *p < 0.05 versus normal controls, †p < 0.05 versus ADR alone (n = 5–6). (H) Immunofluorescence staining shows that antimiR-671-5p preserved renal podocalyxin expression in ADR nephropathy. Arrow indicate positive staining. Scale bar, 20 µm. (I,J) Representative Western blots (I) and graphic presentations of fibronectin and α-SMA (J) were presented. *p < 0.05 versus normal controls, †p < 0.05 versus ADR alone (n = 5–6). (K) Representative micrographs show that antimiR-671-5p inhibited α-SMA expression (upper panel) and renal fibrotic lesions (bottom panel) in different groups as indicated. Scale bar, 50 µm.

