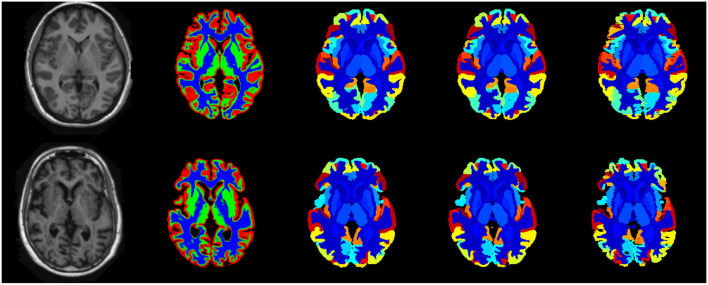
Figure 8.
Best case (scan 1,038, top row) and worst case (scan 1128, bottom row) labellings from the fusion challenge dataset. The figure shows the original T1w scan (first column), the tissue classes (second column) identified using the method of Brudfors et al. (2020), the majority voting labelling (third column), the predicted labels using the proposed FIL method (fourth column) and the manually defined ground truth labels (fifth column).

