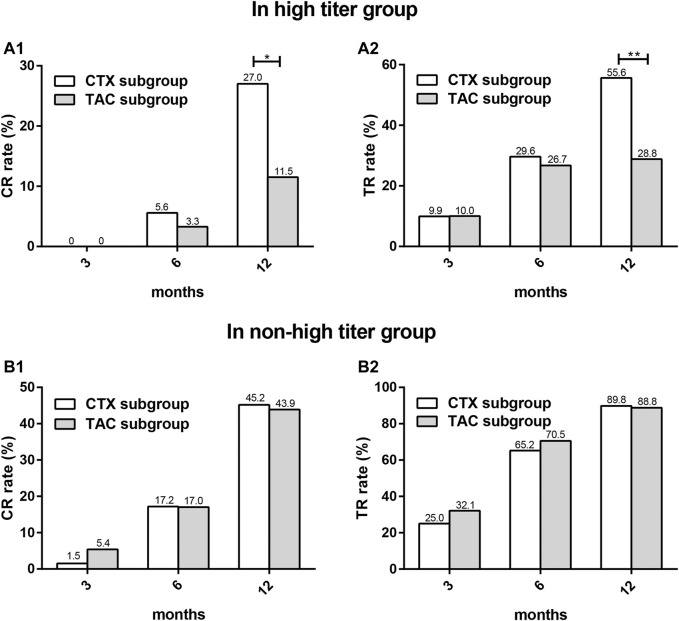
FIGURE 5.
The comparison of CR and TR rates between CTX subgroup and TAC subgroup at different time points in two titer groups. CR (A1) and TR (A2) in high titer group, CR (B1) and TR (B2) in non-high titer group.CR: complete remission; TR: total remission; CTX: cyclophosphamide; TAC: tacrolimus. *p < 0.05, **p < 0.01.

