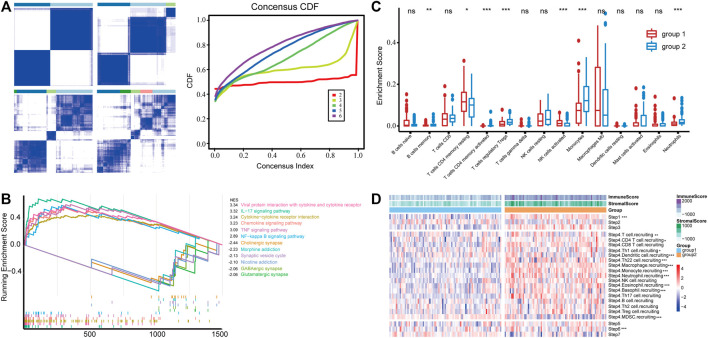
FIGURE 1.
(A) Consensus clustering of the GBM samples based on the expression of IRGs, and empirical cumulative distribution function (CDF) corresponding to the entries of consensus matrices. (B) GSEA analysis of top pathways enriched in group 1 and group 2, respectively. (C) Immune infiltration is estimated by CIBERSORT. Cell with an estimated fraction of 0 in more than half of the samples was filtered. (D) The anti-tumor immune response was divided into seven stepwise events, and the activity of each was assessed using the TIP system. *** in Step 6 suggests that group 1 has a significantly higher TIP score than group 2, and the rest indicate higher in group 2.

