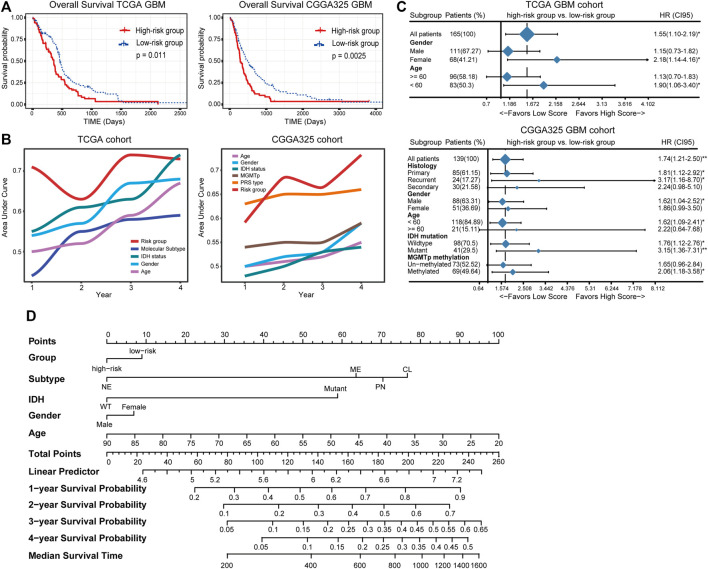
FIGURE 3.
(A) The distinct overall survival between the high- and low-risk groups. (B) The time-dependent predictive power of the risk model and other prevalent clinicopathological parameters. PRS type: primary, recurrent, secondary type of the tumor. (C) The independent prognostic value of the risk score. (D) Nomogram demonstrating time-dependent survival rate for patients with different pathological parameters in clinical practice.

