FIGURE 4.
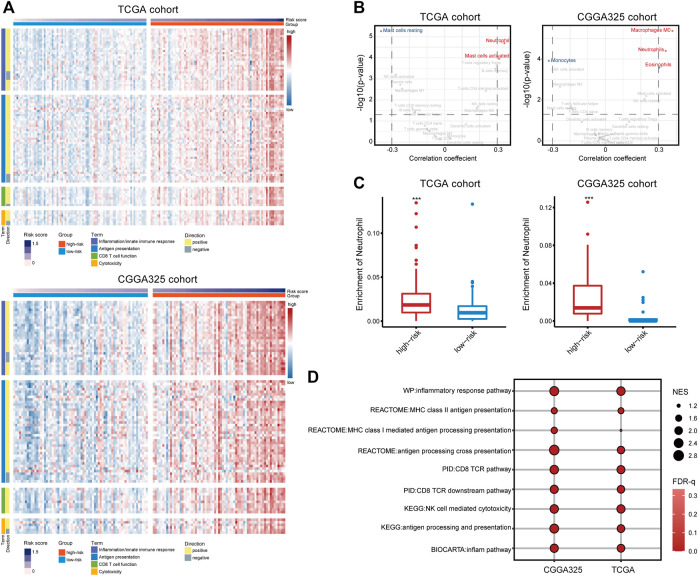
(A) The ssGSEA scores of 103 signaling pathways involved in the inflammation/innate immune response, antigen presentation, CD8 T cell activation, and cytotoxicity. (B) Correlation analysis of the 22 immune cells estimated by CIBEROST with the risk score. (C) The fraction of neutrophils in the high- and low-risk groups. (D) GSEA analysis of pathways involved in the anti-tumor immune response.

