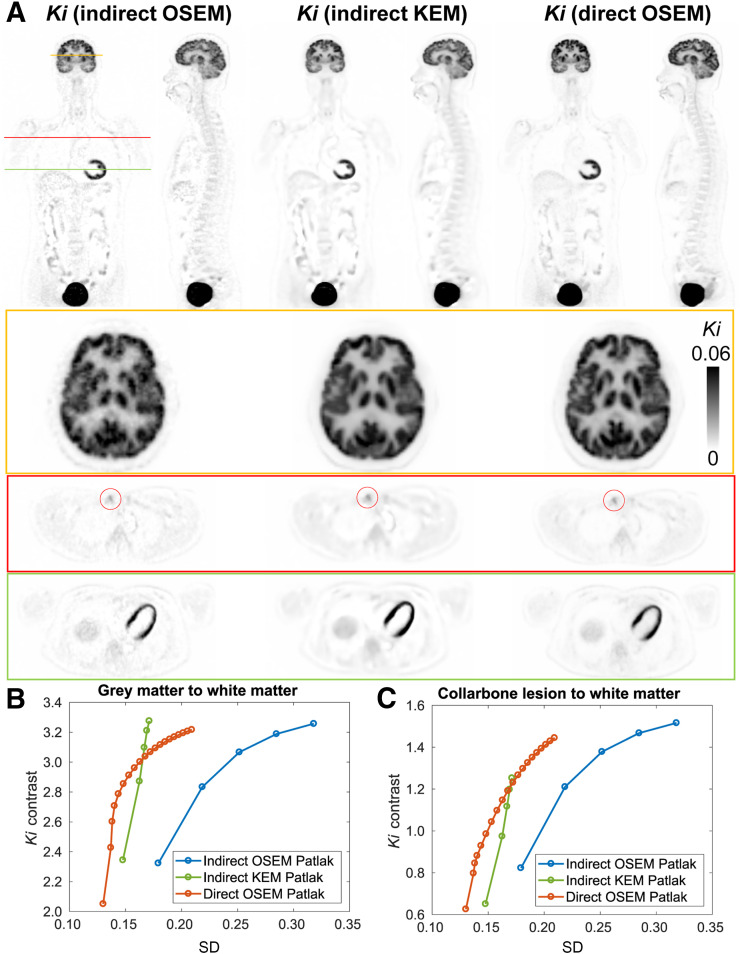
FIGURE 5.
(A) Coronal, sagittal, and transaxial slices of Patlak slope Ki reconstructed by indirect OSEM, indirect kernel-EM (KEM), and direct OSEM. (B) Ki contrast of gray matter to white matter vs. noise curves. SD was calculated in large ROI inside white matter. (C) Ki contrast of focal uptake lesion (red circles) in collarbone to white matter vs. noise curves. SD was calculated using same white matter ROI as in (B). Ki images are shown in inverse gray scale with maximum set to 0.06.

