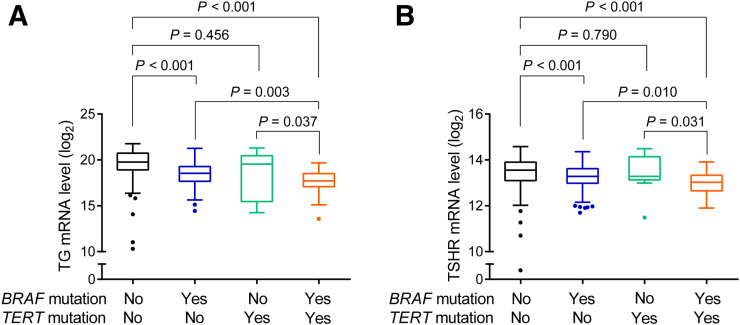
FIGURE 2.
Box plots of messenger RNA (mRNA) expression of thyroid iodide-handling genes in PTC in different genotype backgrounds. (A) Expression of TG gene. (B) Expression of TSHR gene. For each thyroid gene, entire cohort was divided into 4 genotype groups: no mutation, BRAF V600E alone, TERT promoter mutation alone, and genetic duet of 2 coexisting mutations. Central horizontal lines represent medians, and box boundaries represent interquartile ranges. Sample sizes in no mutation, BRAF V600E, TERT promoter mutation, and genetic duet groups were 149, 198, 11, and 28, respectively. TERT promoter mutations here included, collectively, TERT C228T and TERT C250T. P values were calculated using 2-sided Wilcoxon–Mann–Whitney test.

