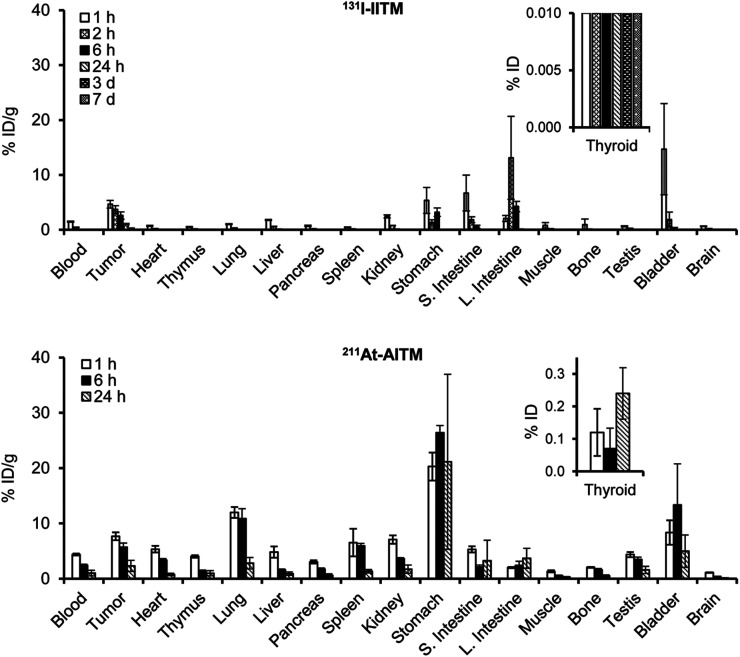
FIGURE 4.
Ex vivo biodistribution after the injection of 131I-IITM and 211At-AITM at designated time points in C57BL/6J mice bearing B16F10 melanomas (n = 4 for each time point). Data are expressed as mean percentage of the injected radioactivity dose per gram of tissue (%ID/g) ± SD. Note that thyroid values are presented as a percentage of the injected radioactivity dose (%ID). L. Intestine = large intestine; S. Intestine = small intestine.

