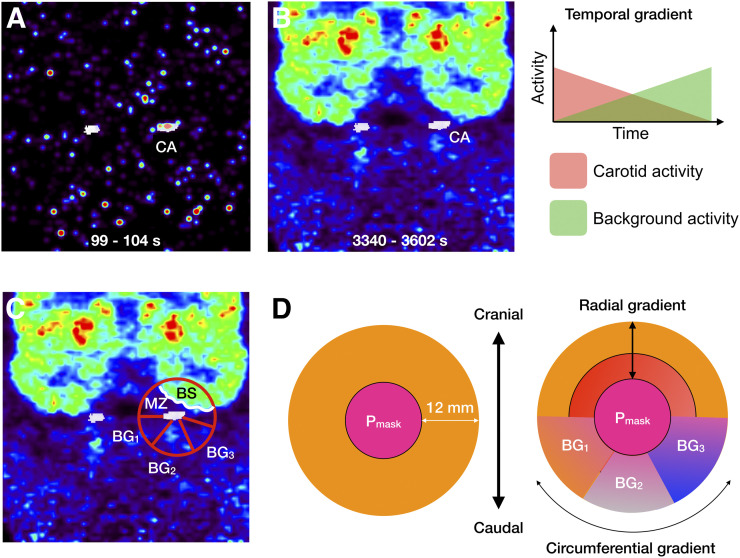
FIGURE 3.
(A and B) PET frame reconstruction with ICA overlay (white) for early (A) and late (B) times after injection. Temporal and spatial variabilities of ICA background can be clearly deduced from images. (C) Tracer distribution in vicinity of ICA displays both radial and circumferential tracer concentration gradients. (D) Definition of subregions in vicinity of Pmask used to account for partial-volume distortions. BG1, BG2, and BG3 = various background regions with homogeneous tracer concentrations; BS = brain activity; CA = measured activity in ICA; MZ = activity in MZ.

