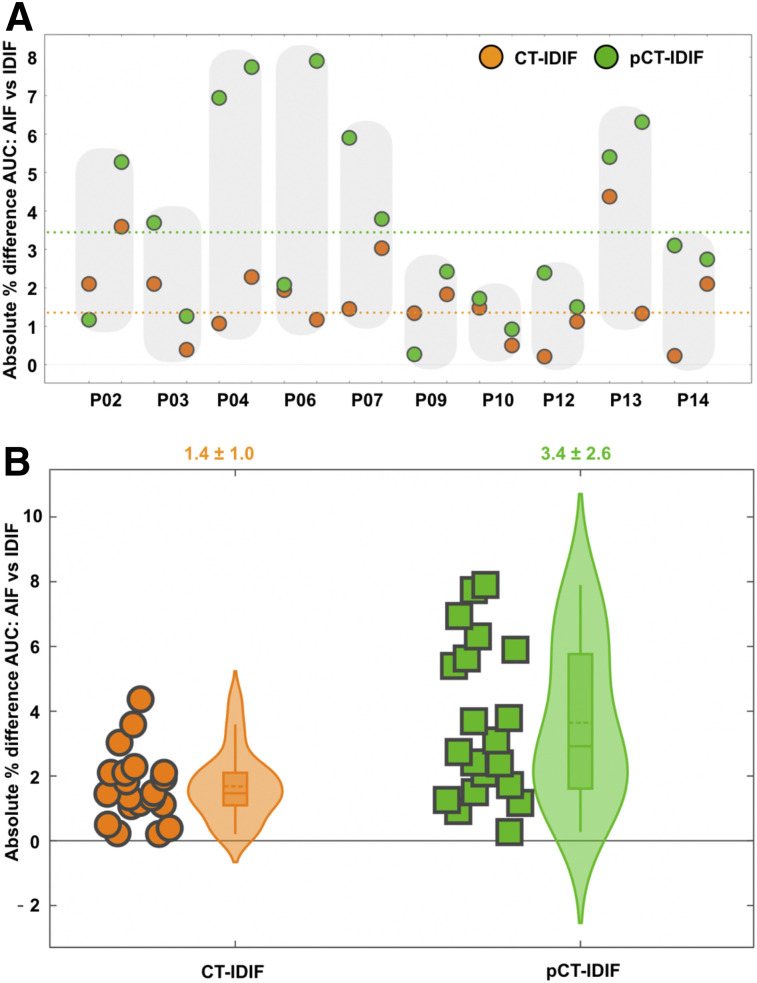
FIGURE 4.
Comparison of IDIFs using AUCs. (A) Individual absolute percentage differences in AUCs for CT-IDIF and pCT-IDIF against AIF. Shaded areas indicate test-retest results for same subject. Broken lines represent mean difference over all scans between AUCs derived using AIF and CT-IDIF (orange) and those derived using AIF and pCT-IDIF (green). (B) Plot of absolute percentage differences in AUCs for AIF and IDIFs (CT-IDIF and pCT-IDIF). Shaded area enclosing box plot indicates probability density distribution for absolute percentage differences. Average absolute percentage difference for both methods was <5% (shown above graph).

