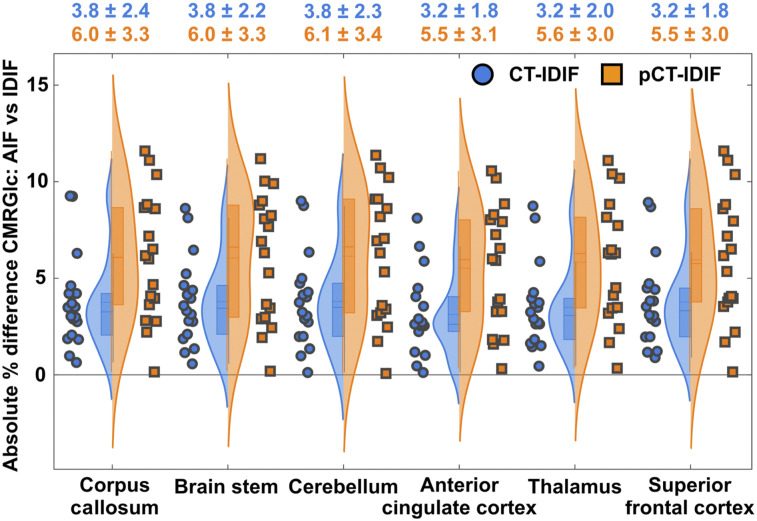
FIGURE 5.
Probability density distribution for absolute percentage differences between CMRGlc values derived using AIF and those derived using IDIFs (CT-IDIF and pCT-IDIF) for 6 different brain regions. Absolute percentage differences in CMRGlc values derived using CT-AC are shown in blue, and those derived using pCT-AC are shown in orange. Mean and SD for each region and 2 AC methods are shown above graph.

