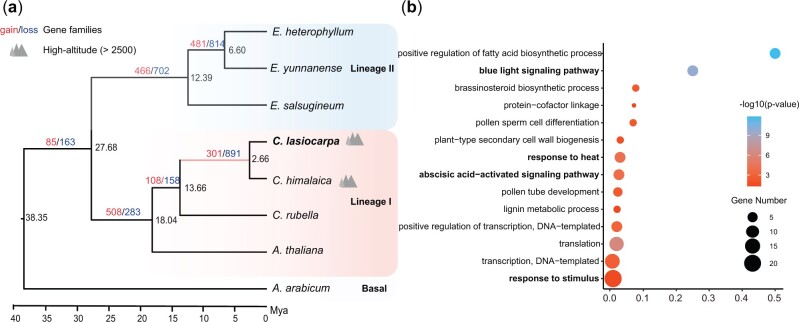
Figure 3.
Phylogenetic analysis of the Crucihimalaya lasiocarpa genome. (a) The phylogenetic placement of C. lasiocarpa, divergence time (million years ago, MYA, black), gene family expansions (red) and contractions (blue) are displayed on a maximum likelihood (ML) tree constructed from 5,993 shared single-copy gene families. (b) Gene ontology (GO) enrichment of significantly expanded gene family of high-altitude clade (highlighted by pink) in a. The colour of circles represents the statistical significance of enriched GO terms. The size of the circles represents the number of genes in a GO term.

