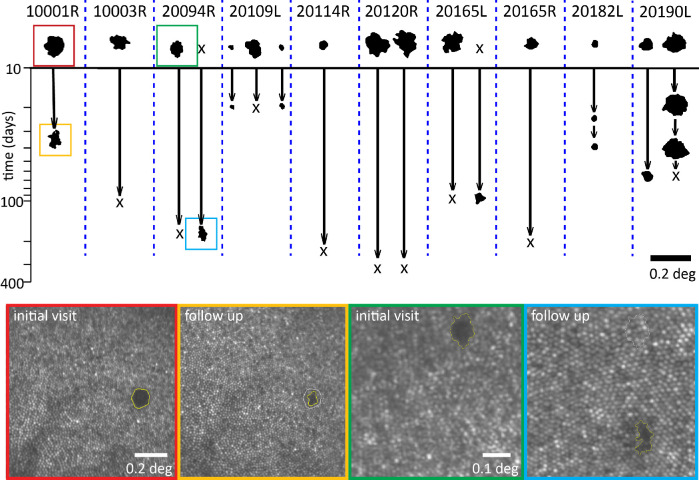
Figure 2.
Timeline of hyporeflective patches in 10 eyes of nine subjects. The y-axis is the time in days since their original sighting. An X at follow-up indicates that the area resolved over time, and an X at the original imaging session indicates that a new hyporeflective patch was seen at follow-up. The images corresponding to the patches inside the colored boxes are shown in the lower panels. Subject 10001R showed partial recovery of reflectivity over 5 weeks. Subject 20094R had complete recovery of one hyporeflective patch, with a new hyporeflective patch appearing in a new location 5.25 months later.

