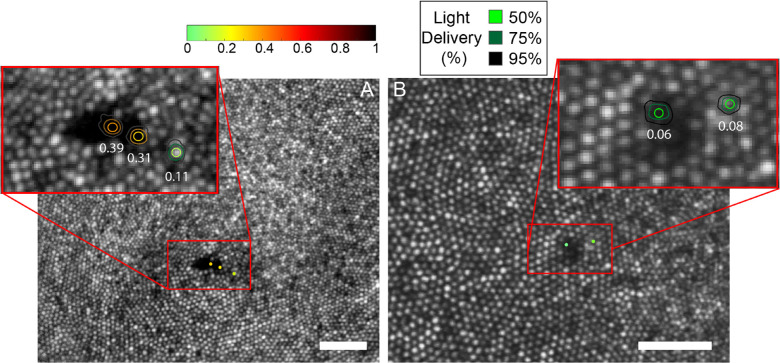
Figure 4.
Microperimetry results for subjects 40104 (left) and 20182 (right). The tested locations are indicated by dots in the larger field image and by contours in each magnified inset where the color of the dot and the central contour depicts the threshold as indicated by the color bar. The scale bars in each image are 0.2°.

